Ethereum (ETH) Price Today: Price Consolidates Near $2,800, Sets Eye On 50 SMA


Ethereum (ETH) price remains quiet on Monday extending the weekend’s low price action. However, Ether, the native coin of the Ethereum blockchain could get the benefit after the new lowest average transaction fee crossed the wire.
- Ethereum (ETH) price starts the fresh trading week on a muted note.
- Expect a 25% upside from the current levels if the support zone holds.
- The 24-hour trading volume reads at $10,041,124,241 down nearly 2%.
As per the latest report, the average transaction fee on the Ethereum network has dropped to the lowest level in four months. Last time, it was mid-September that the fee was this low, as average fees dropped roughly to $15.13 per transfer. Investors are looking at the increased scalability and lower transaction costs that could boost the prospects for the altcoin in the short term.
Ethereum at a crossroad on the daily chart
On the daily chart, after testing the highs of $3,284.75 on Thursday Ethereum (ETH) has found some interim support near $2,800. However, volumes have also declined in tandem with the downfall in the price. Thus, indicating investors declining interest in the liquidation. Rather look for optimistic opportunities near the reliable support zone.
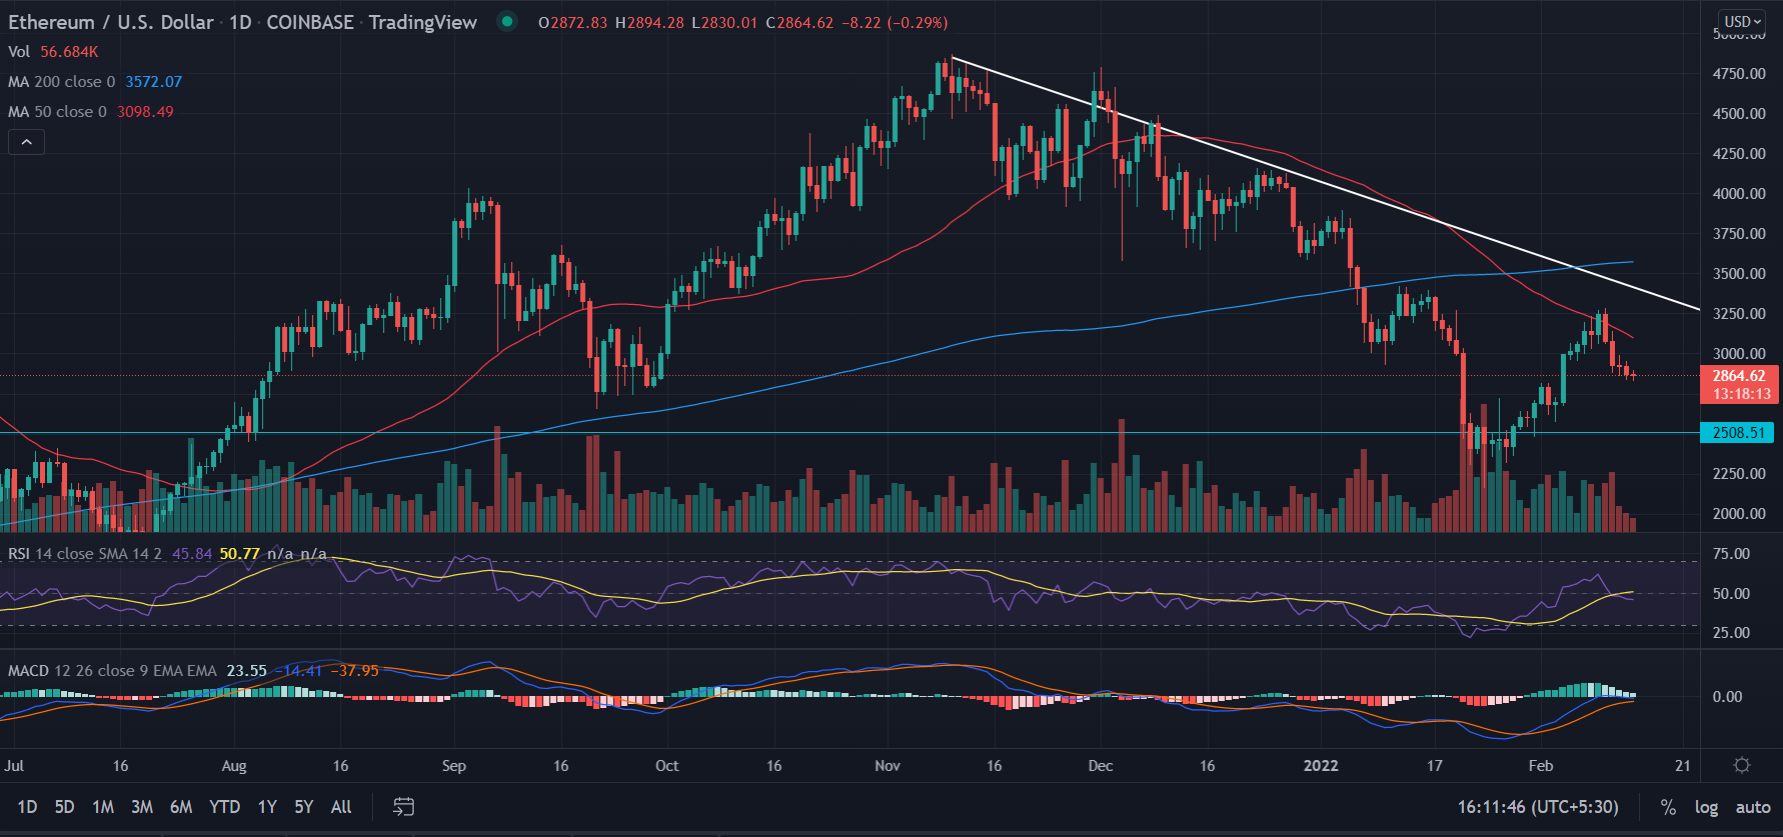
Price has flipped near the crucial support zone of $2,800. Back in September ETH peaked in November and in August tested the highs of $4,030.35 on September 3. This makes the mentioned level a trusted demand zone for the pair.
If the price is able to sustain the session’s low then ETH bulls could immediately jump toward the $3,000k. Further, a decisive break above the 50-day Simple Moving Average (SMA) at $3,098.46 could pierce the bearish slopping line from the highs of $4,867.81.
EHT has been rejected near the mentioned bearish line multiple times, so it would be interesting to watch if that could happen this time.
On the other hand, a resurgence in the selling pressure will drag Eth to seek immediate support near the late January consolidated a range of $2,500.
Technical Indicators:
RSI: The Relative Strength Index (RSI) has given the bearish crossover and reads at 44.
MACD: The Moving Average Convergence Divergence (MACD) holds above midline with a neutral stance.

Why Trust CoinGape
CoinGape has covered the cryptocurrency industry since 2017, aiming to provide informative insights Read more…to our readers. Our journal analysts bring years of experience in market analysis and blockchain technology to ensure factual accuracy and balanced reporting. By following our Editorial Policy, our writers verify every source, fact-check each story, rely on reputable sources, and attribute quotes and media correctly. We also follow a rigorous Review Methodology when evaluating exchanges and tools. From emerging blockchain projects and coin launches to industry events and technical developments, we cover all facets of the digital asset space with unwavering commitment to timely, relevant information.

Related Articles


- Trump’s Board Of Peace Eyes Dollar-Backed Stablecoin For Gaza Rebuild
- Trump’s World Liberty Financial Flags ‘Coordinated Attack’ as USD1 Stablecoin Briefly Depegs
- Trump Tariffs: U.S. Threatens Higher Tariffs After Supreme Court Ruling, BTC Price Falls
- Fed’s Chris Waller Says Support For March Rate Cut Will Depend On Jobs Report
- Breaking: Tom Lee’s BitMine Adds 51,162 ETH Amid Vitalik Buterin’s Ethereum Sales
- COIN Stock Risks Crashing to $100 as Odds of US Striking Iran Jump
- MSTR Stock Price Predictions As Michael Saylor’s Strategy Makes 100th BTC Purchase
- Top 3 Meme Coins Price Prediction As BTC Crashes Below $67k
- Top 4 Reasons Why Bitcoin Price Will Crash to $60k This Week
- COIN Stock Price Prediction: Will Coinbase Crash or Rally in Feb 2026?
- Shiba Inu Price Feb 2026: Will SHIB Rise Soon?


