
Ethereum Price Analysis: Bull Trap Puts $ETH Price at Risk of Major Correction; Sell or Hold?


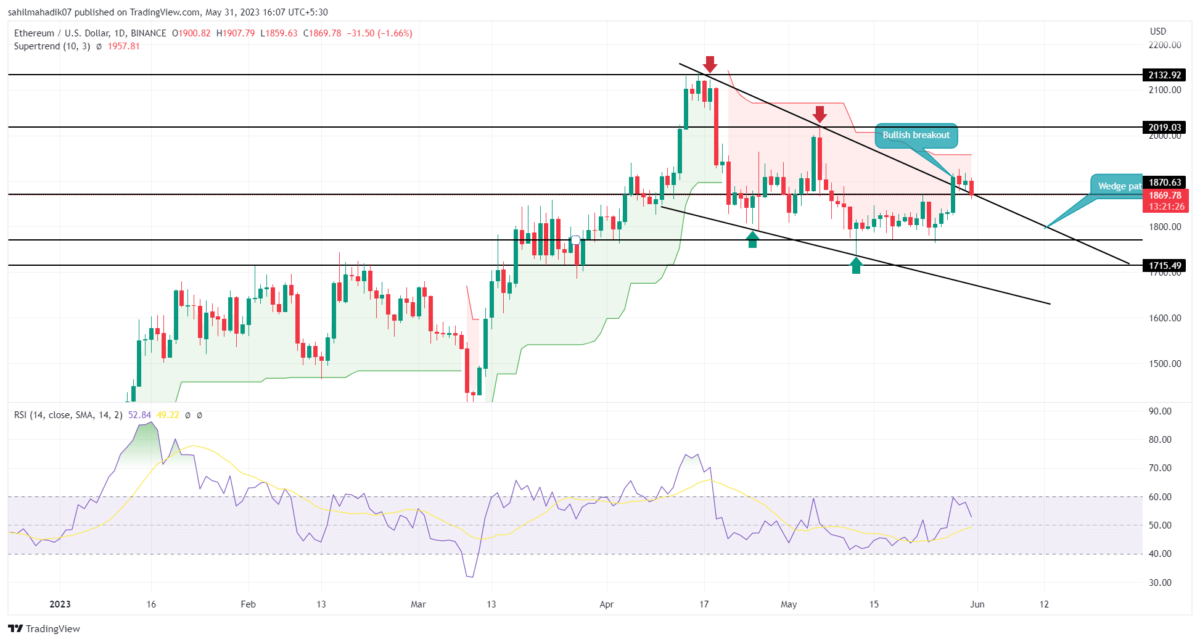
Ethereum Price Analysis: On May 28th, a significant uptick in the crypto market allowed the Ethereum price to clear the downsloping resistance trendline of the wedge pattern. This development was a sign of buyers’ attempt to retake trend control and lead a sustained recovery. However, the price is struggling to sustain above the breached trendline which could lead to a fake breakout scenario and a potential downfall.
Also Read: Crypto Market Selloff: Here’s Why Bitcoin, Ethereum Price Falling Today
Ethereum Price Daily Chart
- The Ethereum price retests the recently reclaimed trendline to check whether prices can sustain higher levels or not.
- A breakdown below the downsloping trendline will hint at the resumption of the prior correction phase.
- The intraday trading volume in Ether is $6.2 Billion, indicating a 34% gain.
 Source- Tradingview
Currently, the Ethereum price trades at the $1871 mark with an intraday loss of 1.58%. The long red candle printed shows a breakdown attempt from the recently reclaimed trendline, indicating the sellers have not thrown the towel yet.
However, a candle closing below the combined support of $1870 and a downsloping trendline will create a bull trap scenario and intensify the selling pressure in the market. Any downfall below the trendline will continue to liquidate the aggressive buyers and their forced sell order could give another boost to downward momentum.
The post-breakdown fall could plunge the ETH price to 1770, followed by $1715-1700.
Conversely, if the coin price shows sustainability above the trendline by the day’s end, the uptrend potential for Ethereum mentioned in our previous article remains intact.
Will Ethereum Price Lose $1800 Mark Again?
A potential breakdown below the aforementioned trend will bring the market sellers back to the ETH price. The breached trendline will again act as a significant resistance to short sell and more likely plunge the price to the next crucial support zone of $1770.
- Relative Strength Index: The daily RSI slope reversal from the 60% mark reflects a lack of buyers’ strength to maintain a strong momentum rally.
- Supertrend: The red film projected in this indicator highlights the overall market trend remains bearish.
Play 10,000+ Casino Games at BC Game with Ease
- Instant Deposits And Withdrawals
- Crypto Casino And Sports Betting
- Exclusive Bonuses And Rewards


Why Trust CoinGape
CoinGape has covered the cryptocurrency industry since 2017, aiming to provide informative insights Read more…to our readers. Our journal analysts bring years of experience in market analysis and blockchain technology to ensure factual accuracy and balanced reporting. By following our Editorial Policy, our writers verify every source, fact-check each story, rely on reputable sources, and attribute quotes and media correctly. We also follow a rigorous Review Methodology when evaluating exchanges and tools. From emerging blockchain projects and coin launches to industry events and technical developments, we cover all facets of the digital asset space with unwavering commitment to timely, relevant information.


- Michael Saylor Hints at Another Strategy Bitcoin Buy With ‘Stretch the Orange Dots’ Post
- Will CLARITY Act Pass in 2026? Galaxy’s Alex Thorn Warns April Deadline Is Critical
- Tom Lee’s Bitmine Adds 5,000 ETH Despite $7.5B Unrealized Loss as BMNR Stock Rebounds
- CLARITY Act Should Ban Stablecoin Yields to Advance in Senate, French Hill Says
- U.S. Set to Deploy Warships to Keep the Strait of Hormuz Open, Bitcoin Climbs
- Solana vs XRP Price Forecast: Can SOL Reclaim Its All-Time High Before XRP Hits $2?
- Top Analyst Predicts Cardano Price Could Surge 100% As Bitcoin Breaks $72k
- What’s Keeping Shiba Inu Below $0.0000065- Analyst Predicts 30% Rise Ahead
- BTC Price to $100K by 2026? Kalshi and Polymarket Odds Climb to 42%
- Why Pi Network Price Surged 30% Today?
- What Happens to XRP Price If US Wins War Against Iran?


