Ethereum Price Analysis: Here’s Why Correction Phase Persists for ETH Price; Back to $1800?


Ethereum Price Prediction: For over a week, the Ethereum price has been under a correction phase, during which it kept resonating between two downsloping trendlines of a flag pattern. Though, this pattern is a bullish continuation pattern, until the downsloping trendlines remain intact, the short-term trend for ETH will remain bearish. Currently, the coin price faces overhead supply pressure at a downsloping trendline indicating sellers may continue the downward trend.
Also Read: Big Options Expiry Stirs Mixed Bitcoin and Ethereum Price Action
Ethereum Price Daily Chart
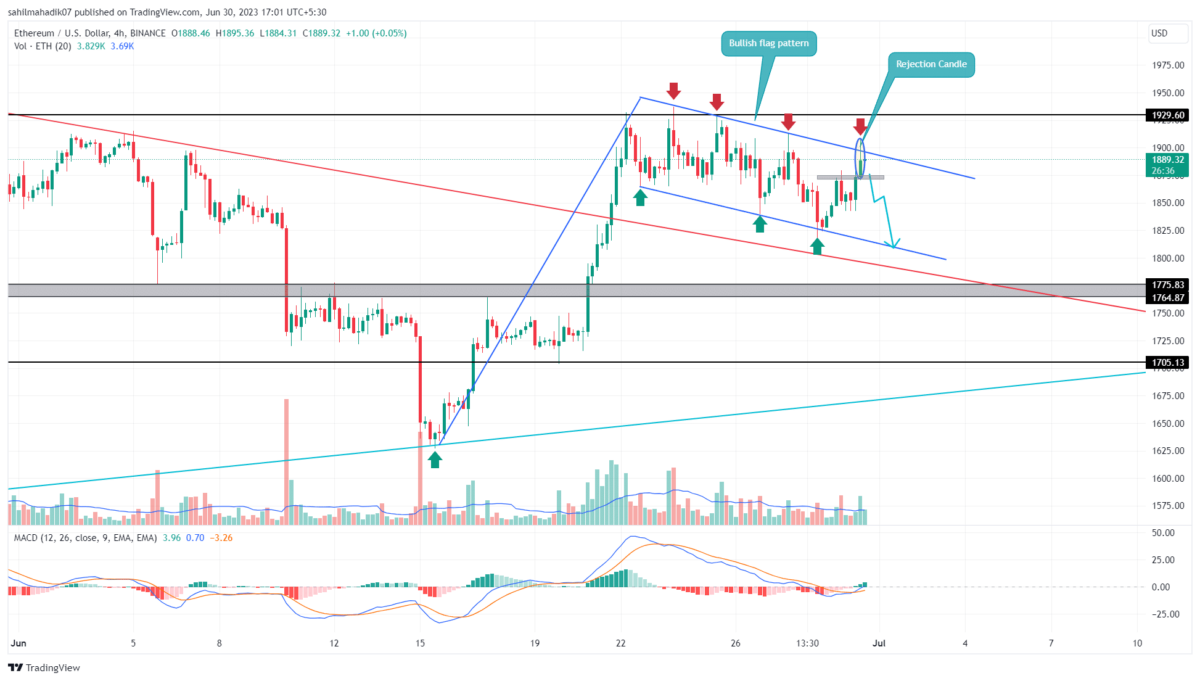
- The rejection candle at the downsloping resistance trendline reflects a deeper correction in the ETH price
- A possible breakdown below $1837 may set the coin’s market value by 4%
- The intraday trading volume in Ether is $7.5 Billion, indicating a 24% gain.
 Source- Tradingview
During the mid-week, the Ethereum price projected a sharp reversal from the $1820 mark, which pushed the coin’s market value by 3.7%. The coin price currently trades at the $1886 mark and showed another failed attempt from the flag pattern.
In the 4-hour time frame chart, the ETH price showed a long-tail rejection at the resistance trendline indicating the overhead supply remains high. This rejection suggests a suitable possibility for a bearish reversal which may set the coin price for another 4% fall to hit $1800.
A 4-hour candle closed below the $1837 mark which is the low of the aforementioned rejection candle would give better confirmation for potential downfall.
Is Ethereum Price Ready to Hit $2000?
Under the influence of the flag pattern, the overall trend for Ethereum price remains bullish. Depending on the current sentiment of the market, the ongoing correction may prolong, but the buyers are poised to break the overhead trendline. A breakout above the resistance trendline will signal the continuation of the prior uptrend and more likely push the prices to $2000, followed by $2130.
- Exponential Moving Average: Amid the current correction, the 20-and-50-day EMA acted as an important pullback support.
- Moving Average Convergence Divergence: The MACD slope(blue) wobbling above the signal line(orange) reflects the overall trend as bullish.

Why Trust CoinGape
CoinGape has covered the cryptocurrency industry since 2017, aiming to provide informative insights Read more…to our readers. Our journal analysts bring years of experience in market analysis and blockchain technology to ensure factual accuracy and balanced reporting. By following our Editorial Policy, our writers verify every source, fact-check each story, rely on reputable sources, and attribute quotes and media correctly. We also follow a rigorous Review Methodology when evaluating exchanges and tools. From emerging blockchain projects and coin launches to industry events and technical developments, we cover all facets of the digital asset space with unwavering commitment to timely, relevant information.

Related Articles


- Satoshi-Era Whale Dumps $750M BTC as Hedge Funds Pull Out Billions in Bitcoin
- XRP Sees Largest Realized Loss Since 2022, History Points to Bullish Price Run: Report
- US Strike on Iran Possible Within Hours: Crypto Market on High Alert
- MetaSpace Will Take Its Top Web3 Gamers to Free Dubai Trip
- XRP Seller Susquehanna Confirms Long-Term Commitment to Bitcoin ETF and GBTC
- Top 4 Reasons Why Bitcoin Price Will Crash to $60k This Week
- COIN Stock Price Prediction: Will Coinbase Crash or Rally in Feb 2026?
- Shiba Inu Price Feb 2026: Will SHIB Rise Soon?
- Pi Network Price Prediction: How High Can Pi Coin Go?
- Dogecoin Price Prediction Feb 2026: Will DOGE Break $0.20 This month?
- XRP Price Prediction As SBI Introduces Tokenized Bonds With Crypto Rewards


