Ethereum Price Analysis: $ETH Price to Retest $1800- Will Buyers Step In?


Ethereum Price Analysis: For nearly a month the Ethereum price has shown a silent recovery under the influence of a broadening channel pattern. Despite the recent volatility in the crypto market the ETH price has strictly resonated within the diverging trendlines of this pattern, accentuating the significant influence of this setup. While the market sentiment remains uncertain, the traders can wait for channel breakout to grab the next directional move.
Also Read: Ethereum Price Momentum Builds With Climbing Open Interest, Will Bulls Rally?
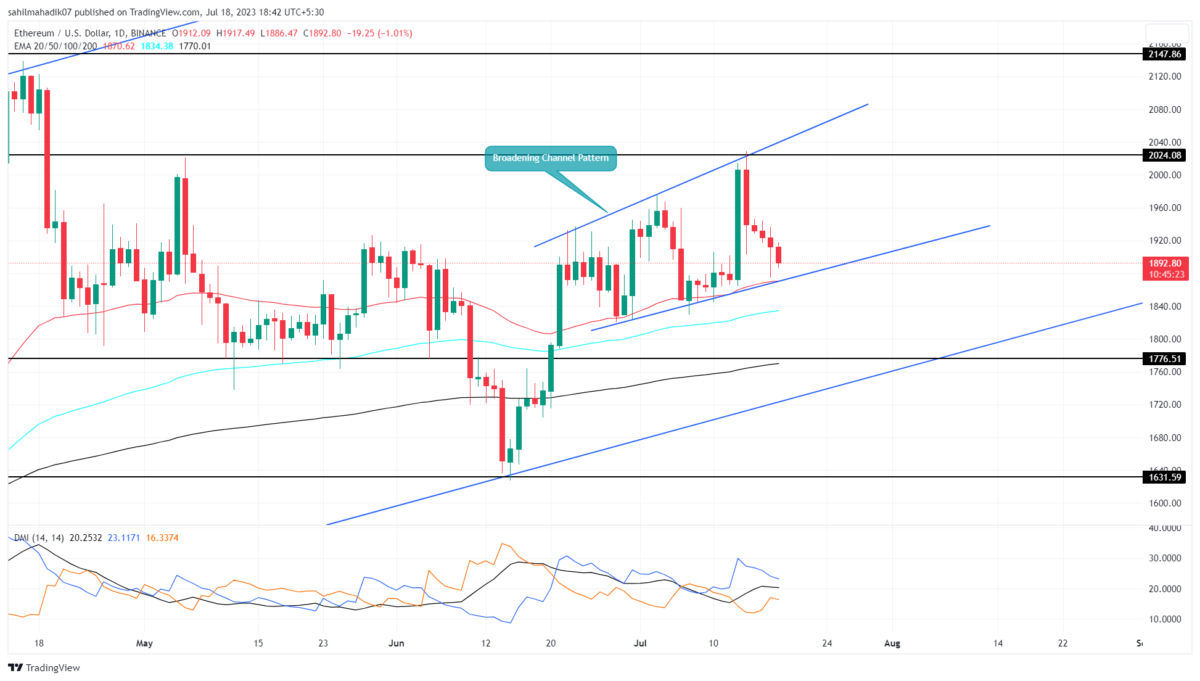
Ethereum Price Daily Chart
- The coin holders can mark current recovery using the rising channel pattern.
- Ethereum Fear and Greed Index at 54% indicates positive sentiment among traders
- The intraday trading volume in Ether is $6.65 Billion, indicating a 29% gain.
 Source- Tradingview
On July 14 the Ethereum price turned down from the combined resistance of $2000 and the resistance trendline of a broadening channel pattern. Thus, the altcoin price has been falling for the past five days, registering a 7% loss. By press time, the ETH price trades at $1894 and continues to wobble within the channel pattern.
With sustained selling, the downtrend would prolong and retest the rising trendline near $1875. The dynamic support should assist buyers to replenish bullish momentum and keep the chart pattern intact.
In ideal conditions, a reversal from the lower trendline should drive the price back to the resistance trendline, which is beyond the $2000 psychological barrier
[converter id=”eth-ethereum” url=”https://coingape.com/price/converter/eth-to-usd/?amount=1″]
Will Ethereum Price Plunge to $1800?
The Ethereum price approaching the lower trendline also holds a possibility of a bearish breakdown. If the sellers breached the rising trendline with a daily candle closing, the bullish pattern will be invalidated. The post-breakdown fall could push the coin price back to $1800-$1775 aligned with the long-coming support trendline
- Directional Movement Index: The DI+(blue) and DI-(orange) slope narrowing close for a bearish crossover indicates the buyers are losing grip on this altcoin.
- Exponential Moving Average: The ETH price moving above the daily EMAs(50, 100, and 200) reflects the overall trend bullish/

Why Trust CoinGape
CoinGape has covered the cryptocurrency industry since 2017, aiming to provide informative insights Read more…to our readers. Our journal analysts bring years of experience in market analysis and blockchain technology to ensure factual accuracy and balanced reporting. By following our Editorial Policy, our writers verify every source, fact-check each story, rely on reputable sources, and attribute quotes and media correctly. We also follow a rigorous Review Methodology when evaluating exchanges and tools. From emerging blockchain projects and coin launches to industry events and technical developments, we cover all facets of the digital asset space with unwavering commitment to timely, relevant information.

Related Articles


- XRP Realized Losses Spike to Highest Level Since 2022, Will Price Rally Again?
- Crypto Market Rises as U.S. and Iran Reach Key Agreement On Nuclear Talks
- Trump Tariffs: U.S. Raises Global Tariff Rate To 15% Following Supreme Court Ruling
- Bitwise CIO Names BTC, ETH, SOL, and LINK as ‘Mount Rushmore’ of Crypto Amid Market Weakness
- Prediction Market News: Kalshi Faces New Lawsuit Amid State Regulatory Crackdown
- Dogecoin Price Prediction Feb 2026: Will DOGE Break $0.20 This month?
- XRP Price Prediction As SBI Introduces Tokenized Bonds With Crypto Rewards
- Ethereum Price Rises After SCOTUS Ruling: Here’s Why a Drop to $1,500 is Possible
- Will Pi Network Price See a Surge After the Mainnet Launch Anniversary?
- Bitcoin and XRP Price Prediction As White House Sets March 1st Deadline to Advance Clarity Act
- Top 3 Price Predictions Feb 2026 for Solana, Bitcoin, Pi Network as Odds of Trump Attacking Iran Rise


