 Buy $GGs
Ethereum Price Analysis: ETH Retraces Toward $1,850; Is Correction Just Started?


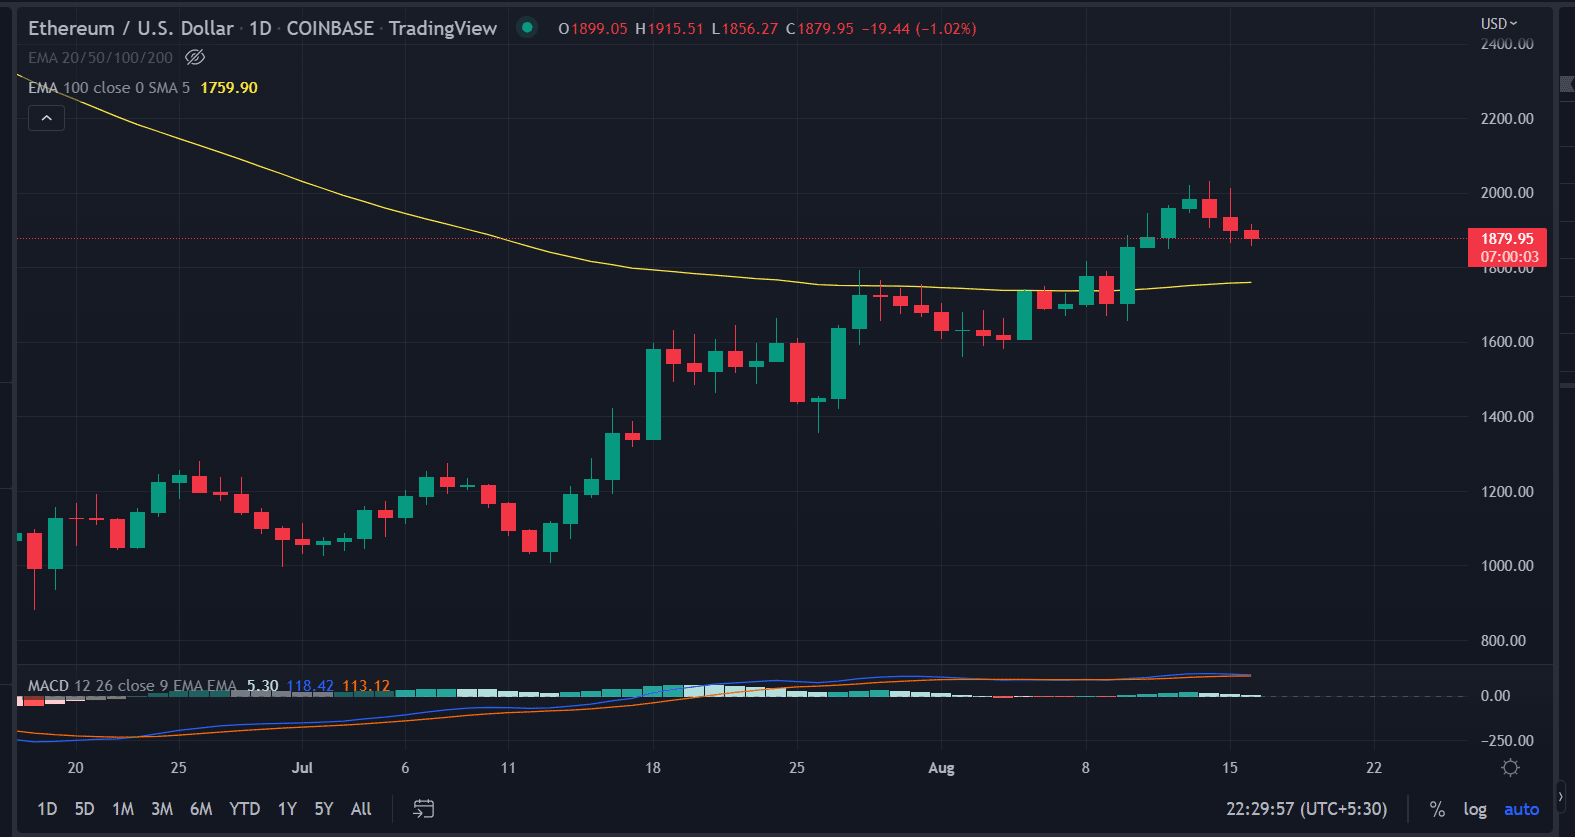
Ethereum price analysis shows the continuation of the bearish momentum. The price moved in a very narrow trading range that extends from $1,915 to $1,850. The market structure favors a corrective pullback after a decent upswing of nearly 45% from the lows of $1,005.25.
ETH retraces from the $1,900 mark following a period of consolidation after testing the crucial $2,000 mark on Saturday. But the formation of the small candlestick indicates the market is not favoring a reversal rather it could be taken as a healthy correction. Sidelined investors could enter near the lower levels to capitalize on the positive sentiment.
As of publication time, ETH/USD is trading at $1,877, down 1.13% for the day. The 24-hour trading volume has declined by 17.34%, totaling $15.88 billion according to CoinMarketCap data. A decline in price with receding volumes is a sign of weakening of downside momentum.
- Ethereum price extends downside for the third straight day.
- Crucial support near $1,850 is vital for bulls to sustain.
- The momentum oscillator warns of aggressive bids.
Ethereum price enters into a consolidation phase
On the daily chart, the Ethereum price analysis implies an impeding correction provided some conditions are met.
The formation of the ‘Spinning top’ on Thursday followed by a series of red candlesticks promotes the current lower price action.
Currently, the price is held near the crucial support zone of $1,850-70, if the bulls failed to hold the level on the daily basis the gates will be open for further lower levels. Bulls need more buying participation in successfully flipping the support into the resistance zone.
A daily close below $1,850 could fall up to the 100-day exponential moving average at $1,759.
On the other hand, a spike in buying orders could push back into a higher trajectory. A candlestick above $1,900 could be a sign of the bulls gaining control.
The Moving Average Convergence Divergence (MACD) indicator is currently bullish, as can be seen in the green color of the histogram. Moreover, the oscillator points at the preceding bullish momentum as expressed by the tops of the histogram.
Also read: Will Ethereum’s Upsurge Continue Post Merge?
ETH price action has set a swing high of $2,000 in the previous week. ETH has been making higher highs and lower lows forming a classic bullish channel. However, the bulls are taking a breather near the higher levels.
Conclusion:
Ethereum price analysis tells the extended consolidation. As the downside is capped near the crucial support level. We expect ETH/USD to make rounds near the lower levels until confirmation arises.
Play 10,000+ Casino Games at BC Game with Ease
- Instant Deposits And Withdrawals
- Crypto Casino And Sports Betting
- Exclusive Bonuses And Rewards


Why Trust CoinGape
CoinGape has covered the cryptocurrency industry since 2017, aiming to provide informative insights Read more…to our readers. Our journal analysts bring years of experience in market analysis and blockchain technology to ensure factual accuracy and balanced reporting. By following our Editorial Policy, our writers verify every source, fact-check each story, rely on reputable sources, and attribute quotes and media correctly. We also follow a rigorous Review Methodology when evaluating exchanges and tools. From emerging blockchain projects and coin launches to industry events and technical developments, we cover all facets of the digital asset space with unwavering commitment to timely, relevant information.

Related Articles


- Peter Brandt Flips Bullish, Predicts Bitcoin Rally As Price Holds Above $70k
- XRP News: Institutional Use Case Expands as Doppler Finance Integrates WXRP for Multi-Chain Access
- Trump Tariffs: Bitcoin Faces Fresh Headwinds as 15% Global Tariffs Begin This Week Amid Iran War
- Bitget Unveils ‘Crypto Anti-Bias Pledge’ To Support Women’s Inclusion In Crypto
- U.S.-Iran War: Crypto Market Rebounds as Iran Reportedly Reaches Out To U.S. To End Conflict
- Dogecoin Price Outlook as BTC Recovers Above $73,000
- XRP Price Prediction as Iran-U.S. Peace Talks Trigger a Crypto Rally
- COIN Stock Analysis as Bitcoin Retests $72k Ahead of February NFP Data
- Robinhood Stock Price Prediction As Cathie Wood Buys $12M Dip in Bold ARK Move
- Bitcoin Price At Risk? Professor Who Predicted US-Iran War Says America Could Lose
- Gold Price Prediction March 2026: Rally, Crash, or Record Highs?


