Ethereum Price Analysis: Is $1650 Support a Safe Haven in the Face of Market Downturn?


Ethereum Price Analysis: Amidst the June 10th sell-off in the crypto market, the Ethereum price gave a high momentum breakdown from the $1775-$1764 support zone. This price level supported the buyers for over two months despite the highly volatile phase, indicating the holders lost a crucial footing. Thus, this breakdown is likely to boost selling pressure in the ETH price and extend the prevailing correction phase.
Also Read: Ethereum Co-Founder Names Three Key Transitions to Watch as Network Grows
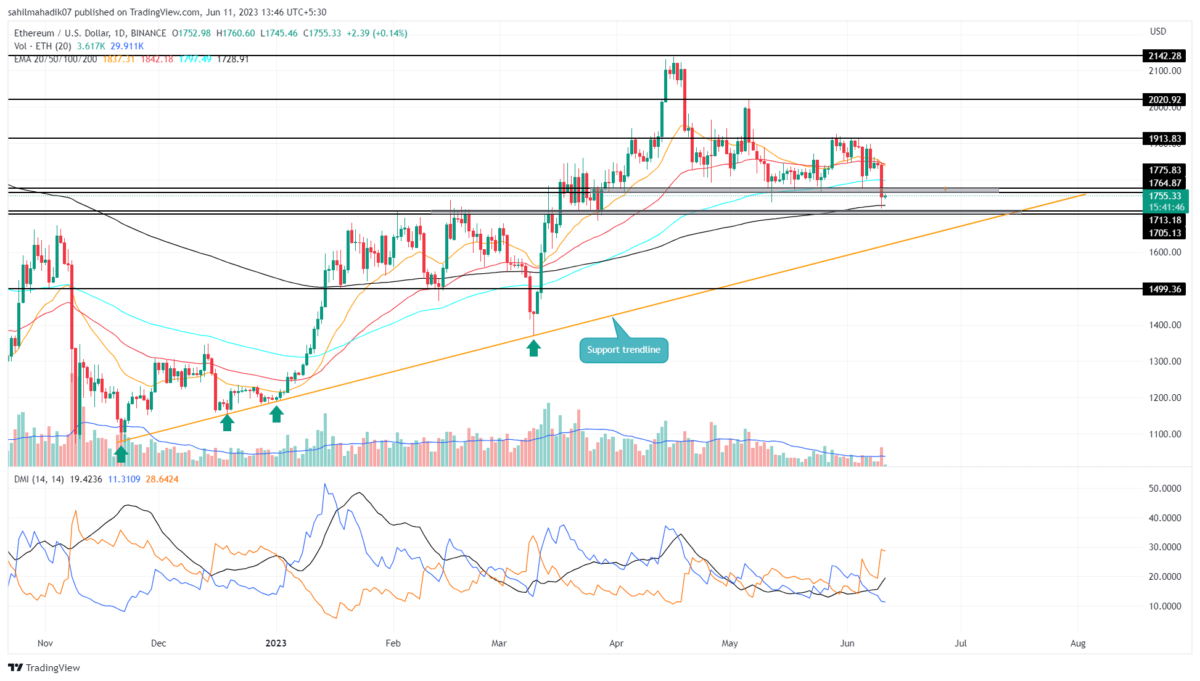
Ethereum Price Daily Chart
- The ascending trendline is the representation of the current bull run in the ETH price
- The bearish breakdown below the $1775-$1764 set the coin price for a potential 6% drop
- The intraday trading volume in Ether is $4.6 Billion, indicating a 0.27% loss.
 Source- Tradingview
The Ethereum price closing below the last swing low of $1775-$1765 reflects a continuation signal of the ongoing correction phase. By the press time, the ETH price trades at $1750, with an intraday gain of 0.14%.
If the coin price sustains above the breached support in the coming days, the altcoin will slide lower and meet the $1700 mark. This psychological support aligned with the 200-day EMA creates a high area of interest for buyers to reaccumulate.
Under a pessimistic approach, a breakdown below $1700 will pull the price back to the combined support of $24000 and ascending trendline. This dynamic support could offer traders great pullback opportunities as it did in December 2022, followed by January and March 2023.
Conversely, a breakdown below the support trendline with daily candle closing will trigger a free fall in ETH.
Will Ethereum Price Plunge below $1650?
While the overall market sentiment favors a downfall in Ethereum price, the daily chart shows some crucial support that can hold buyers at higher levels. The $1700 horizontal support and the angular trendline are suitable accumulation zones that can undermine the current downfall and recuperate the bullish momentum. Until the support trendline is intact, the ETH price is less likely to fall below $1650.
- Directional Movement Index: The expanding gap between the DI slopes in a bearish alignment(DI- above DI+) highlights a bear trend sentiment among traders.
- Exponential Moving Average: A bearish crossover between the 20-and-50-day EMA brings additional selling momentum in the ETH price

Why Trust CoinGape
CoinGape has covered the cryptocurrency industry since 2017, aiming to provide informative insights Read more…to our readers. Our journal analysts bring years of experience in market analysis and blockchain technology to ensure factual accuracy and balanced reporting. By following our Editorial Policy, our writers verify every source, fact-check each story, rely on reputable sources, and attribute quotes and media correctly. We also follow a rigorous Review Methodology when evaluating exchanges and tools. From emerging blockchain projects and coin launches to industry events and technical developments, we cover all facets of the digital asset space with unwavering commitment to timely, relevant information.

Related Articles


- BTC Price Falls as Initial Jobless Claims Come In Below Expectations
- Breaking: CME Group To Launch 24/7 BTC, ETH, XRP, SOL Futures Trading On May 29
- White House to Hold CLARITY Act Meeting With Ripple, Coinbase, Banks Today
- Senator Warren Warns Fed Against Bitcoin Crash Rescue Amid Liquidity Pump Claims
- Top 5 Reasons Ethereum Price Is Down Today
- Top 3 Price Predictions Feb 2026 for Solana, Bitcoin, Pi Network as Odds of Trump Attacking Iran Rise
- Cardano Price Prediction Feb 2026 as Coinbase Accepts ADA as Loan Collateral
- Ripple Prediction: Will Arizona XRP Reserve Boost Price?
- Dogecoin Price Eyes Recovery Above $0.15 as Coinbase Expands Crypto-Backed Loans
- BMNR Stock Outlook: BitMine Price Eyes Rebound Amid ARK Invest, BlackRock, Morgan Stanley Buying
- Why Shiba Inu Price Is Not Rising?


