Ethereum Price Analysis: Crucial Levels to Watch as $ETH Price Shows Recovery Signs


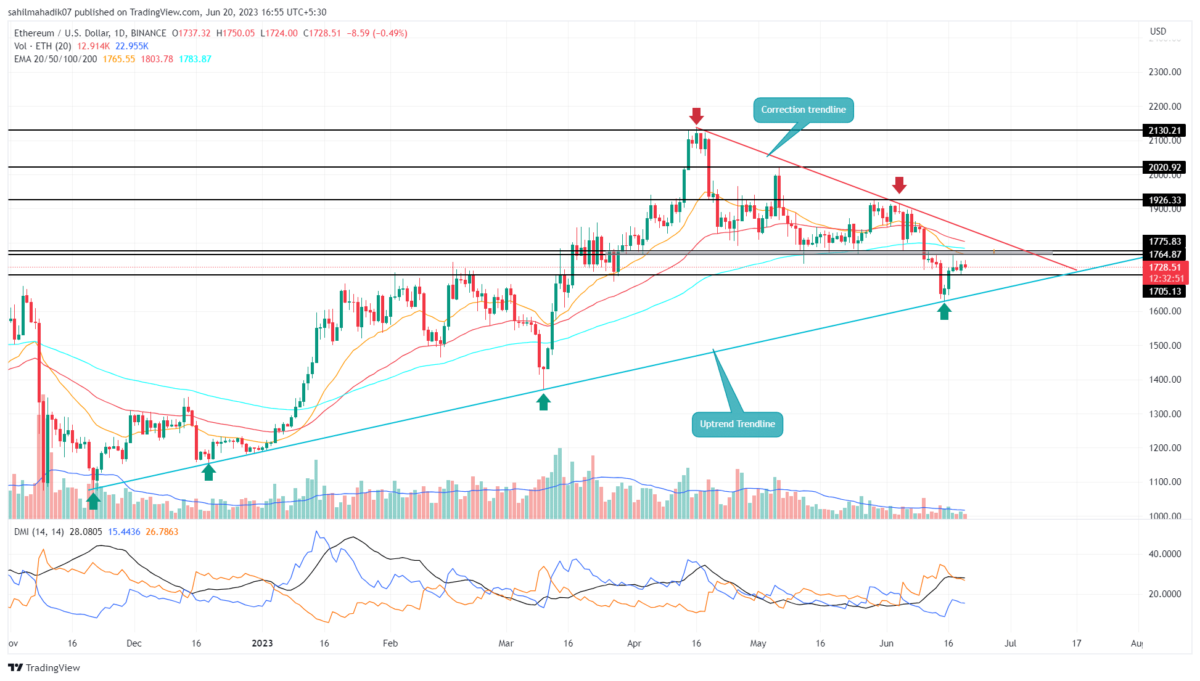
Ethereum Price Prediction: On June 15th, the falling Ethereum price found significant footing at an ascending support trendline(blue) and triggered a new relief rally. Thus, the coin price surged 8.5% in just three days and reached the immediate resistance of $1775-$1765. However, the selling pressure accumulated at this barrier has halted the rising prices that indicate the ETH coin price may witness a minor consolidation before establishing a significant recovery rally.
Also Read: JPMorgan Backs Hinman Speech On Ethereum; Crypto Expert Says This Is Not The Case
Ethereum Price Daily Chart
- Higher price rejection candles at $1775-$1765 reflect the sellers are actively defending this level
- A breakdown below the support trendline could trigger a massive correction in the Ethereum price
- The intraday trading volume in Ether is $5.7 Billion, indicating a 57.5% gain.
 Source- Tradingview
Over the past four days, the Ethereum price has been moving sideways below the $1775-$1765 resistance. The daily candle projected short-bodied candles and relatively longer rejection wicks on the upside indicating the prices are witnessing overhead supply pressure.
This overhead resistance continues to pressurize buyers and may trigger a temporary sideways trend. However, amid the potential consolidation, a retest to the lower trendline may attract more buyers interested in discounted prices.
Anyhow, for buyers to obtain a sustained recovery rally, the buyers need to breach $1775 and the downsloping trendline. This breakout could signal a resurgence of bullish momentum and offer traders a long opportunity with a potential target of $1926, $2020, and $2130.
Is ETH Price Ready for Recovery?
Under the influence of a resistance trendline(red), the Ethereum price is still under a correction phase. With the current uncertainty in the market, the coin price may go sideways below the $1775 level before making an attempt to rise higher. However, a breakout above the trendline could project a signal of significant recovery.
- Directional Movement Index: The DI+ and DI- slope gradually closing in for a positive crossover project losing bearish momentum.
- Exponential Moving Average: The daily EMAs(20, 50, and 100) wavering near the $1775 barrier created a high supply zone for traders.

Why Trust CoinGape
CoinGape has covered the cryptocurrency industry since 2017, aiming to provide informative insights Read more…to our readers. Our journal analysts bring years of experience in market analysis and blockchain technology to ensure factual accuracy and balanced reporting. By following our Editorial Policy, our writers verify every source, fact-check each story, rely on reputable sources, and attribute quotes and media correctly. We also follow a rigorous Review Methodology when evaluating exchanges and tools. From emerging blockchain projects and coin launches to industry events and technical developments, we cover all facets of the digital asset space with unwavering commitment to timely, relevant information.

Related Articles


- Bitcoin vs Gold Feb 2026: Which Asset Could Spike Next?
- Top 3 Reasons Why Crypto Market is Down Today (Feb. 22)
- Michael Saylor Hints at Another Strategy BTC Buy as Bitcoin Drops Below $68K
- Expert Says Bitcoin Now in ‘Stage 4’ Bear Market Phase, Warns BTC May Hit 35K to 45K Zone
- Bitcoin Price Today As Bulls Defend $65K–$66K Zone Amid Geopolitics and Tariffs Tensions
- COIN Stock Price Prediction: Will Coinbase Crash or Rally in Feb 2026?
- Shiba Inu Price Feb 2026: Will SHIB Rise Soon?
- Pi Network Price Prediction: How High Can Pi Coin Go?
- Dogecoin Price Prediction Feb 2026: Will DOGE Break $0.20 This month?
- XRP Price Prediction As SBI Introduces Tokenized Bonds With Crypto Rewards
- Ethereum Price Rises After SCOTUS Ruling: Here’s Why a Drop to $1,500 is Possible


