
Ethereum Price Analysis: Rising Channel Aims For $2,000; Are You Holding It?


Ethereum price analysis makes a strong upside move today. The bulls were finally able to flip the $1,800 support into a resistance level. The ETH is recovering from the previous session’s consolidation and is traded in the green.
However, the price is following the short-term upside trend. Now, the Ethereum price holds near the crucial $1,800 juncture, a make or break level for investors.
- Ethereum remained on a high note on the first day of the trading week.
- ETH bulls could aim for $2,000 with sustained buying pressure.
- The momentum oscillator favors the bulls in the short term.
After testing the highs of $1,792.55 on July 28, the price followed the previous pattern and retraced for a brief period. It made a low of $1,560. ETH surged 16% in the five trading sessions.
We expect ETH to scale higher in the coming few sessions.
As of publication time, ETH/USD is exchanging hands at $1,808, up 6.30% in the past 24 hours. According to CoinMarketCap data, the trading volume rose 36% at $14,460,521,144.
ETH looks for upside continuation
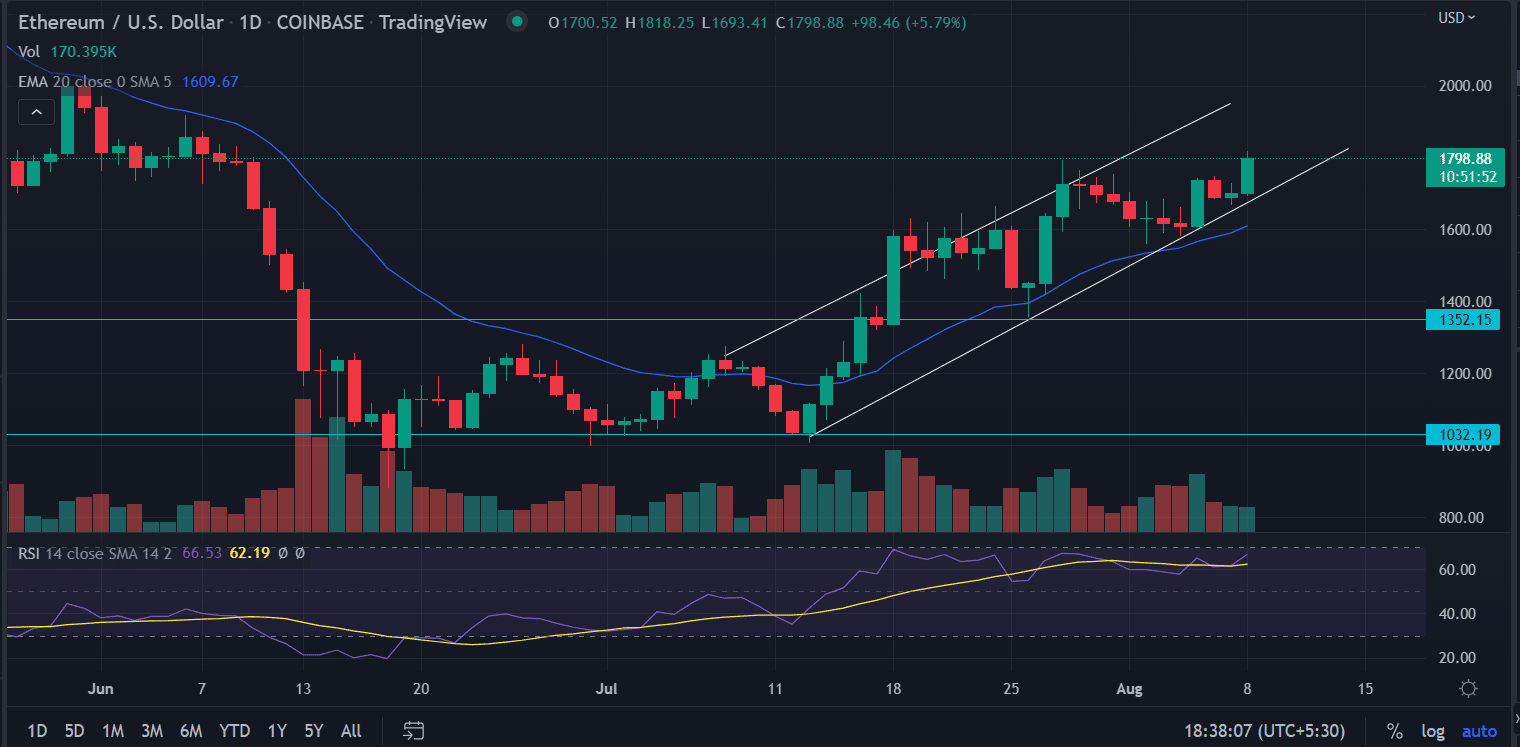
On the daily chart, the Ethereum price formed an ‘Ascending pattern”, making higher lows and higher highs from the lows of $1005.25.
On June 10, ETH fell from the highs of $1,802.85 and depreciated nearly 50% to test the all-time low near $8,80. Sicnem then the price entered into a state of consolidation for a month and hovers in a range of $1,000 and $1,350.
ETH finally gave a breakout above the resistance level on July 17, and now is sustaining with good volumes , which is a positive sign.
Today’s closing of ETH price above $1740 is crucial if the bulls need to maintain the upside moemtnum.
Ethereum price found reliable support at the 20-day exponential moving average at $1,417 as the price continues to rally inside the ascending channel. On moving higher, the first upside target is placed at June 8 high of $1,838 followed by the psychological $2,000 level.
The RSI(14) is trading above 50, indicating that the average gain is larger than the average loss. Any uptick in the indicator would strengthen in the bullish outlook.
Also read: https://coingape.com/how-could-ethereum-classic-etc-perform-next-month-on-chain-data/
On the flip side, a break below the lower trendline of the channel would target the 20-day exponential moving average at $1,566.
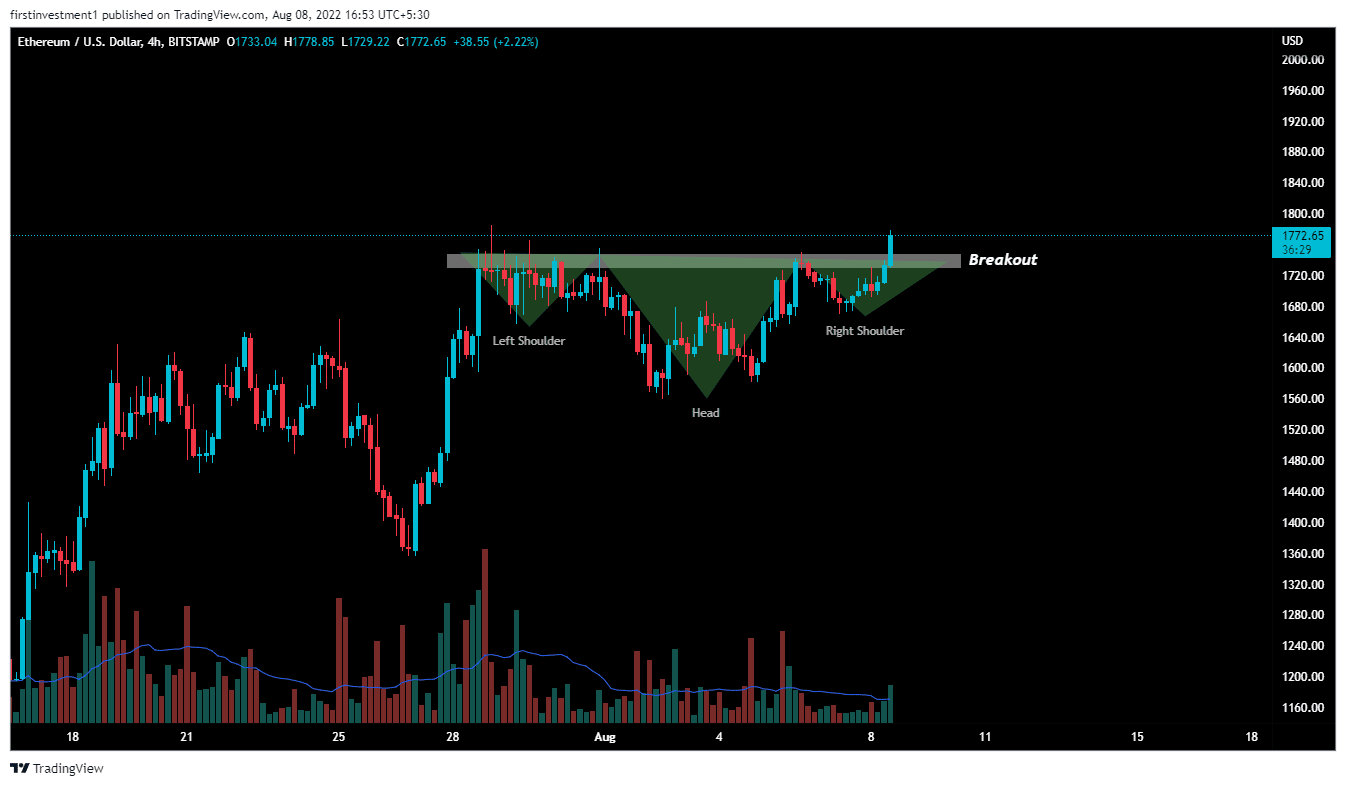
On the four-hour time frame, the Ethereum price analysis gave a breakout of inverted bullish “Head & Shoulder pattern”, According to this pattern, ETH can go up to the level of $1830.
On the other hand, a break below the sessions’s low $1,690 level could invalidate the bullish outlook. And the price can fall below $1,560 the low of August 2.
Play 10,000+ Casino Games at BC Game with Ease
- Instant Deposits And Withdrawals
- Crypto Casino And Sports Betting
- Exclusive Bonuses And Rewards


Why Trust CoinGape
CoinGape has covered the cryptocurrency industry since 2017, aiming to provide informative insights Read more…to our readers. Our journal analysts bring years of experience in market analysis and blockchain technology to ensure factual accuracy and balanced reporting. By following our Editorial Policy, our writers verify every source, fact-check each story, rely on reputable sources, and attribute quotes and media correctly. We also follow a rigorous Review Methodology when evaluating exchanges and tools. From emerging blockchain projects and coin launches to industry events and technical developments, we cover all facets of the digital asset space with unwavering commitment to timely, relevant information.


- TRUMP Coin Whales Reach 5-Month High Ahead Gala Luncheon For Top Token Holders
- CLARITY Act: Crypto Industry and Banks Near Deal as Bill’s Odds Jump Above 60%
- Breaking: Trump Says Iran Wants To Make A Deal With U.S., Bitcoin Rises
- Top 3 factors Why XRP Price is Skyrocketing Today (16th March)
- Ethereum Targets $4K as Peter Brandt Flags Potential ETH Bottom
- MSTR Stock Prediction as Strategy Makes Largest Bitcoin Purchase in 2026 and Analyst Targets BTC Price $100K
- Pi Network Price Prediction After Smart Contract and Second Migration Launch
- Pepe Coin Price Surges 20%- How High Can it Go in March?
- Is XRP Price Gearing Up For $2 Level As BTC Rebounds Above $74k?
- Cardano’s $0.50 Resistance- Can “Midnight” Alpha Defy the Fog of War?
- Bitcoin and XRP Price Outlook If the Senate Banking Committee Approves the CLARITY Act


