
Ethereum Price Analysis: Will Ongoing Correction Push $ETH Price Below $1800?


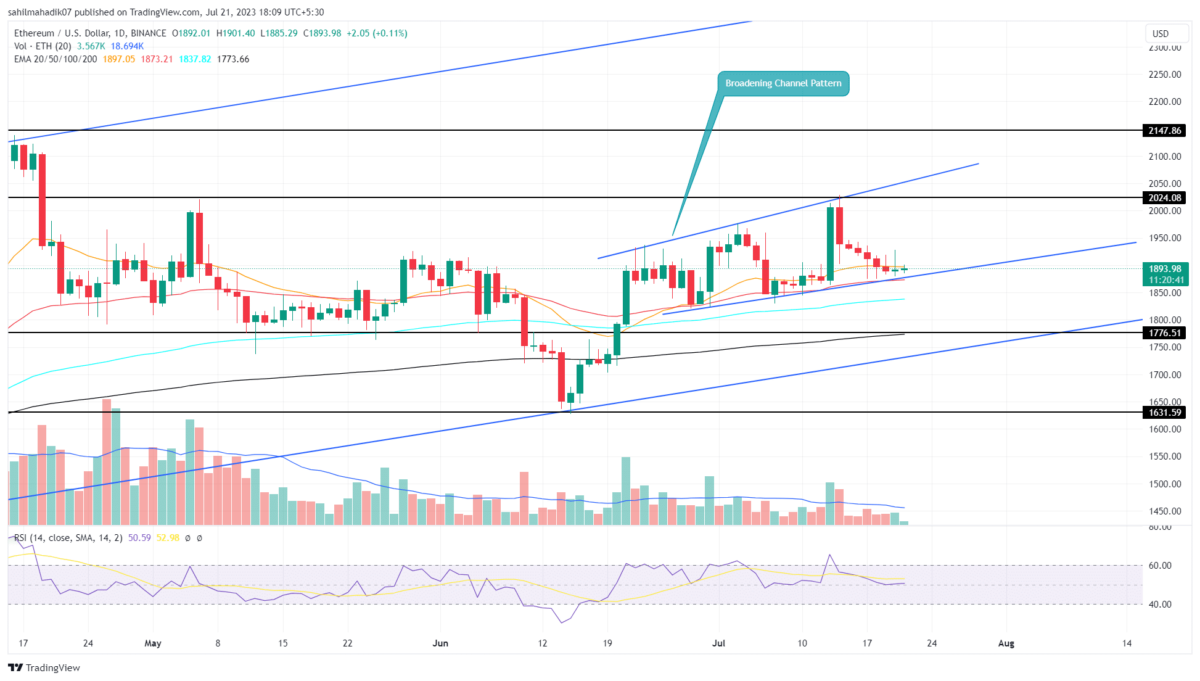
Ethereum Price Analysis: Despite the current volatility in the cryptocurrency market, the Ethereum price has demonstrated impressive recovery, consistently adhering to the diverging trendlines of broadening channel patterns. This pattern developed signals a period of increased volatility and indecision between buyers and sellers. Thus, interested traders can for this chart setup’s maturity grab a direct trade in the second-largest cryptocurrency.
Also Read: Ethereum Price Dump Incoming? ETH CEXs Inflows Hits 2-Month High
Ethereum Price Daily Chart
- A bearish breakdown from a lower support trendline could trigger a significant correction
- The 200-day EMA wavering near the $1800 level indicates a strong demand zone
- The intraday trading volume in Ether is $6.3 Billion, indicating a 14% gain.
 Source- Tradingview
After witnessing a steady correction for over a week, the Ethereum price plunged to the lower support trendline of the wedge pattern. The daily candles with short bodies and rejections on both sides indicate an uncertain market sentiment.
By the press time, the ETH price trades at $1885 with an intraday loss of 0.34%. Anyhow, a common outcome for a rising wedge pattern is the breakdown below the support trendline, accelerating the downside momentum.
A breakdown below the support trendline with a daily candle will signal the continuation of the correction phase and could plunge the price back to $1800 support.
The $1800 level accompanied by a long-coming support trendline and 200-day EMA could offer sold footing for coin buyers. Thus, the sellers are less likely to break this barrier with a weak bearish momentum.
Can ETH Price Rise back to $2000?
If the coin price manages to hold the lower trendline for a few more trading days, the buyers could reattempt to bounce higher and prolong the current recovery cycle. This bullish reversal could lead the price back to an overhead trendline wobbling around $2050. However, a breakout above the resistance trendline is needed to give better confirmation of higher growth.
Play 10,000+ Casino Games at BC Game with Ease
- Instant Deposits And Withdrawals
- Crypto Casino And Sports Betting
- Exclusive Bonuses And Rewards


Why Trust CoinGape
CoinGape has covered the cryptocurrency industry since 2017, aiming to provide informative insights Read more…to our readers. Our journal analysts bring years of experience in market analysis and blockchain technology to ensure factual accuracy and balanced reporting. By following our Editorial Policy, our writers verify every source, fact-check each story, rely on reputable sources, and attribute quotes and media correctly. We also follow a rigorous Review Methodology when evaluating exchanges and tools. From emerging blockchain projects and coin launches to industry events and technical developments, we cover all facets of the digital asset space with unwavering commitment to timely, relevant information.


- Breaking: U.S. Prepares for Potential Peace Talks in Iran War as Trump Mulls ‘Winding Down’ Military Efforts
- Crypto Market Recovers as Expert Warns U.S. Easing of Iran Sanctions Won’t Stabilize Oil Prices
- CLARITY Act May Still Delay Despite Stablecoin Yield Deal, Galaxy’s Alex Thorn Warns
- MSTR, COIN, HOOD Stock Prices Crash As FED Rate Hike Odds Climb to 50% in 2026
- US Congress Schedules Tokenization Hearing Next Week as CLARITY Act Advances
- Ethereum, XRP, and Solana Price Prediction As CLARITY Act Advances After Senate–White House Deal
- Why is Pi Network Price Up Today (March 21) Despite Market Wide Correction?
- Bittensor (TAO) Price Surges 20% After Nvidia CEO Comments
- Dogecoin, Shiba Inu, and Pepe Coin Price Prediction If BTC Holds $70k Level
- Cardano (ADA) Price Prediction Amid SEC/CFTC Policy Shift and ETF Update
- Crypto Stock to Watch As Bitcoin Price Crashed Below $70k; CRCL, COIN, MSTR, HOOD


