
Ethereum Price Analysis: Will $ETH Break Below $1800 Amidst Uncertain Markets?


Ethereum Price Analysis: Amid the ongoing uncertainty cryptocurrency market, the Ethereum price demonstrated a silent recovery within the diverging trendlines of the broadening channel pattern. This chart pattern formation itself is a sign of increasing volatility and the indecisive nature of market participants. Thus, a recent breakdown of this pattern’s support trendline reflects the upcoming drop in ETH price. However, is this reason enough to go bearish on the second-largest cryptocurrency?
Also Read: Ethereum Price Dump Incoming? ETH CEXs Inflows Hits 2-Month High
Ethereum Price Daily Chart
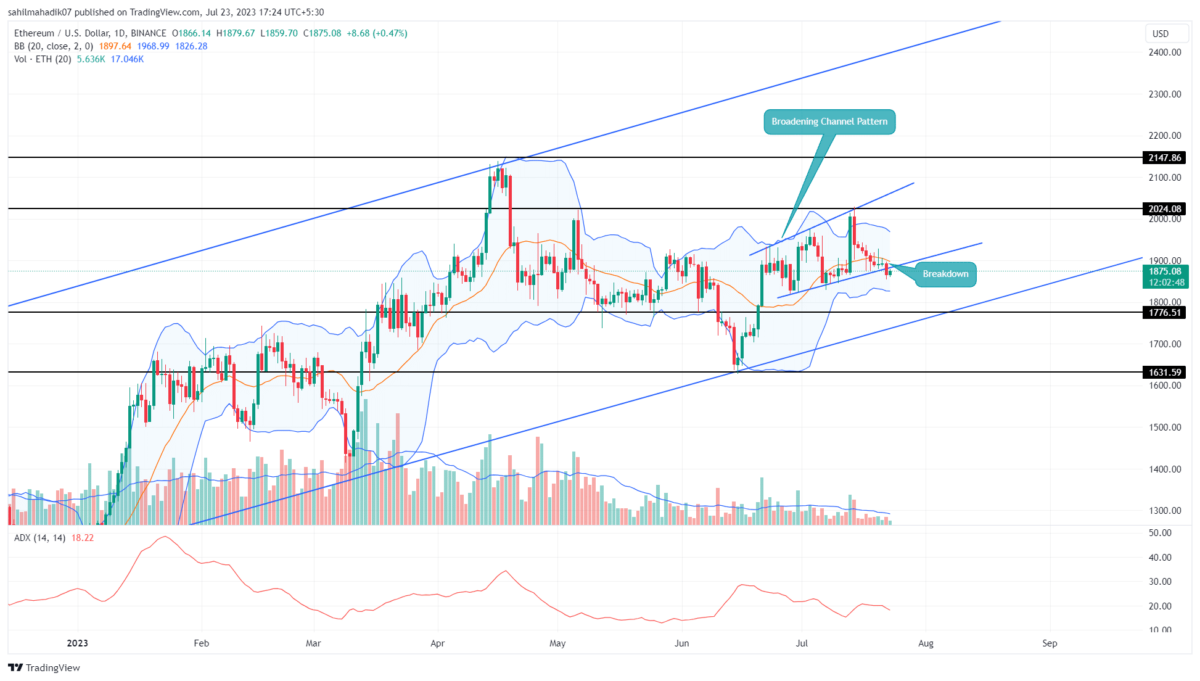
- A bearish breakdown from a lower support trendline sets the ETH price at a 6-7% drop.
- The $1800 support level coinciding with the long-coming support trendline keeps the overall Ethereum price bullish
- The intraday trading volume in Ether is $4.27 Billion, indicating a 1.6% gain.
 Source- Tradingview
In the past fortnight, the Ethereum price experienced significant fluctuations within the diverging trendlines of the broadening channel pattern. On July 14th, the coin reached a high of $2024, but in a sharp turn of events, the value plummeted 7.8% and reached the current price of $1875. This steep downfall was characterized by a bearish breakdown from the wedge pattern’s support trendline, signaling a prolonged correction phase.
Following the bearish breakdown, the Ethereum price exhibited a slight recovery with an intraday gain of 0.48%. The sellers took the opportunity to retest the previously breached support trendline and seek a suitable resistance level to bolster further fall.
If the coin price sustains below the flipped trendline, the altcoin price could plunge another 5-6% to retest the combined support level at $1800, aligning with a long-standing support trendline.
ETH Price Long-Term Outlook Remains Bullish
Despite the anticipated downfall, the long-term bullish trend for Ethereum remains intact as long as the ascending support trendline persists. This dynamic stands as a stronghold for bulls, and a sustained hold above this support would suggest continued positive momentum for ETH Price. In the last seven months, the coin price has rebounded from this support several times indicating a suitable platform for accumulation.
- Average Directional Index: The downtick in the daily ADX slope indicates a drop in bullish momentum, but not a strong confirmation for sellers too.
- Bollinger Band: The flattish lower band of the Bollinger band indicator could offer significant support to crypto buyers’ increase and the possibility of a rebound.
Play 10,000+ Casino Games at BC Game with Ease
- Instant Deposits And Withdrawals
- Crypto Casino And Sports Betting
- Exclusive Bonuses And Rewards


Why Trust CoinGape
CoinGape has covered the cryptocurrency industry since 2017, aiming to provide informative insights Read more…to our readers. Our journal analysts bring years of experience in market analysis and blockchain technology to ensure factual accuracy and balanced reporting. By following our Editorial Policy, our writers verify every source, fact-check each story, rely on reputable sources, and attribute quotes and media correctly. We also follow a rigorous Review Methodology when evaluating exchanges and tools. From emerging blockchain projects and coin launches to industry events and technical developments, we cover all facets of the digital asset space with unwavering commitment to timely, relevant information.


- Breaking: U.S. Prepares for Potential Peace Talks in Iran War as Trump Mulls ‘Winding Down’ Military Efforts
- Crypto Market Recovers as Expert Warns U.S. Easing of Iran Sanctions Won’t Stabilize Oil Prices
- CLARITY Act May Still Delay Despite Stablecoin Yield Deal, Galaxy’s Alex Thorn Warns
- MSTR, COIN, HOOD Stock Prices Crash As FED Rate Hike Odds Climb to 50% in 2026
- US Congress Schedules Tokenization Hearing Next Week as CLARITY Act Advances
- Ethereum, XRP, and Solana Price Prediction As CLARITY Act Advances After Senate–White House Deal
- Why is Pi Network Price Up Today (March 21) Despite Market Wide Correction?
- Bittensor (TAO) Price Surges 20% After Nvidia CEO Comments
- Dogecoin, Shiba Inu, and Pepe Coin Price Prediction If BTC Holds $70k Level
- Cardano (ADA) Price Prediction Amid SEC/CFTC Policy Shift and ETF Update
- Crypto Stock to Watch As Bitcoin Price Crashed Below $70k; CRCL, COIN, MSTR, HOOD


