 Buy $GGs
Ethereum Price Analysis: Will Megaphone Pattern Trigger a New Recovery Cycle to $2200?


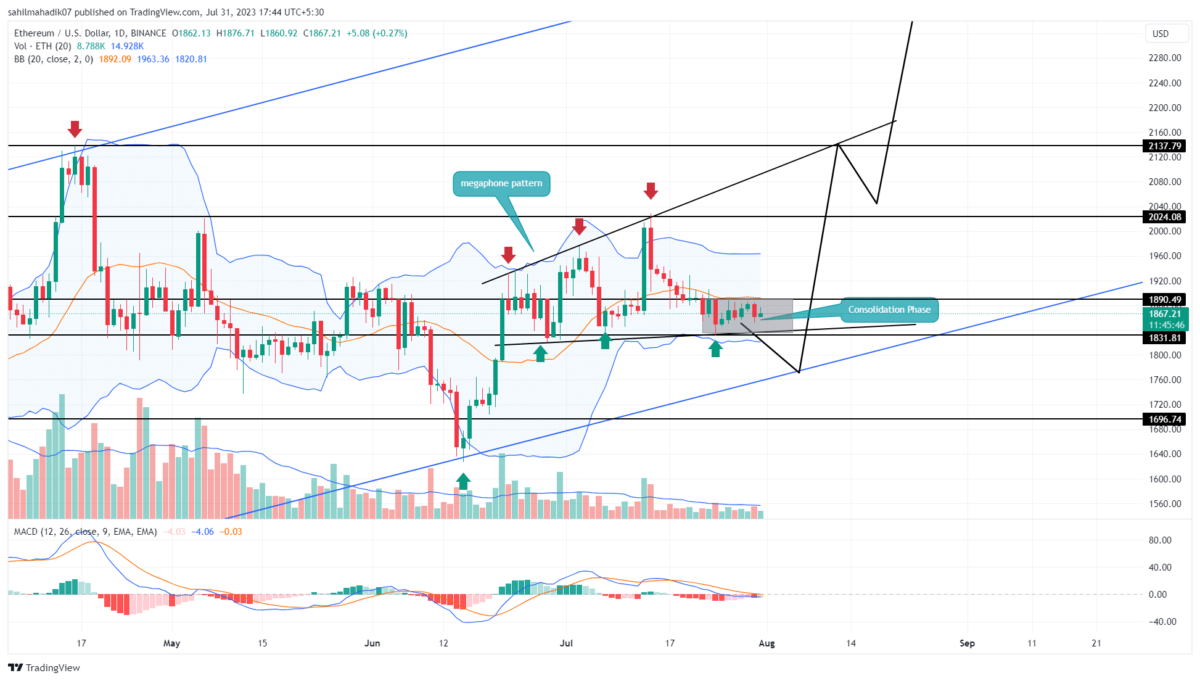
Ethereum Price Analysis: Amid the increasing FUD in the crypto market, the Ethereum price correction phase stalled at the support of the megaphone pattern near the $1830 mark. This support was expected to bolster buyers for a bullish reversal, but the price trend turned sideways. The consolidation reflects a weakness in bullish momentum as buyers fail to push the altcoin higher despite obtaining strong support. Will ETH price rebound to $2000 or the correction phase may prolong below $1800?
Also Read: Ethereum Price Charts Signal Buy The Dip Opportunity Ahead
Ethereum Price Daily Chart
- The price range between $1890 and $1830 creates a no-trading zone.
- A bullish breakout from the $1890 resistance would trigger a new recovery cycle within the megaphone pattern
- The intraday trading volume in Ether is $4.8 Billion, indicating a 48% gain.
 Source- Tradingview
On July 24th, the Ethereum price witnessed a 2% intraday fall and reached the bottom trendline of the megaphone pattern at $1830. Since then the price trend turned sideways and remained within the range of the aforementioned red candle.
The $1890 resistance and $1830 support are the crucial levels that can influence the near future trend of ETH coins. Currently, the second-largest cryptocurrency Ethereum trades at $1868, with a bullish candle of 0.3% gain.
If the overhead supply continues to pressure the market participants, a breakdown below the pattern support trendline and $1830, will increase the selling momentum. The breakdown may. pull the price to $1800 support, registering a potential 4% drop.
The anticipated pullback to $1800 can allow interested traders to accumulate at the support trendline carrying the current uptrend.
[converter id=”eth-ethereum” url=”https://coingape.com/price/converter/eth-to-usd/?amount=1″]
Here’s How ETH Price May Regain $2000 Mark
For Ethereum price to regain its bullish recovery, the buyers need to break the overhead resistance of $1890. This breakout will indicate the microphone pattern is still intact and the bull cycle within this structure could lead Ethereum price near $2200.
- Bollinger band: The lower support of Bollinger band moving sideways could offer strong support for crypto buyers.
- Moving average convergence divergence: the MACD(blue) and signal(Orange) lines going flat at the median level indicate uncertainty traders.
Play 10,000+ Casino Games at BC Game with Ease
- Instant Deposits And Withdrawals
- Crypto Casino And Sports Betting
- Exclusive Bonuses And Rewards


Why Trust CoinGape
CoinGape has covered the cryptocurrency industry since 2017, aiming to provide informative insights Read more…to our readers. Our journal analysts bring years of experience in market analysis and blockchain technology to ensure factual accuracy and balanced reporting. By following our Editorial Policy, our writers verify every source, fact-check each story, rely on reputable sources, and attribute quotes and media correctly. We also follow a rigorous Review Methodology when evaluating exchanges and tools. From emerging blockchain projects and coin launches to industry events and technical developments, we cover all facets of the digital asset space with unwavering commitment to timely, relevant information.

Related Articles


- XRP News: Ripple Unveils Funding Hub To Support Innovation On XRPL
- ZachXBT Names Axiom Exchange in Alleged Employee Crypto Insider Trading Investigation
- Bitcoin Falls as U.S. Jobless Claims Signal Labor Market Rebound
- Bitcoin News: CitiBank to Launch BTC Services in 2026
- Deutsche Bank-Backed AllUnity Launches First MiCA-Compliant Swiss Franc Stablecoin
- Top 2 Price Predictions Ethereum and Solana Ahead of March 1 Clarity Act Stablecoin Deadline
- Pi Network Price Prediction Ahead of Protocol Upgrades Deadline on March 1
- XRP Price Outlook As Jane Street Lawsuit Sparks Shift in Morning Sell-Off Trend
- Dogecoin, Cardano, and Chainlink Price Prediction As Crypto Market Rebounds
- Will Solana Price Rally to $100 If Bitcoin Reclaims $72K?
- XRP Price Eye $2 Rebound as On-Chain Data Signals Massive Whale Accumulation


