 Buy $GGs
Ethereum Price Eyes $2500 As Next Target; Is It A Good Time To Enter?


On June 2nd, the Ethereum price formed a bullish morning star candle at the recently breached resistance trendline, indicating that the buyers are sustaining at higher chart levels. The trendline which previously acted as a dynamic resistance now offers suitable support suggesting the market sentiment shifting from selling on rallies to buying on dips. Can the potential recovery in ETH price reach $2000?
Also Read: Bitcoin, Ethereum Recover On Debt Ceiling Deal, US Fed Pause, Easing Jobs Market
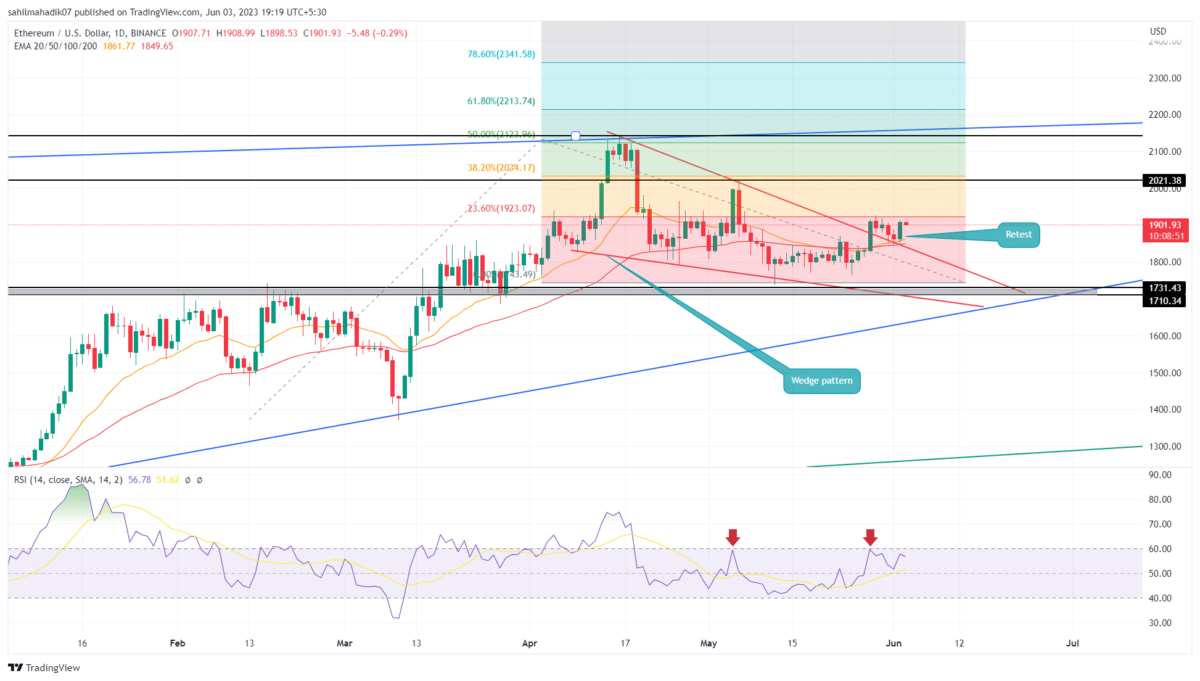
Ethereum Price Daily Chart
- The Ethereum fear and greed index at 56% reflects the market sentiment support bullish recovery
- The rising ETH price may witness a minor hurdle at $1922 aligned with the 23.6% Fibonacci extension level.
- The intraday trading volume in Ether is $4.2 Billion, indicating a 31% gain.
 Source- Tradingview
A bullish breakout from the wedge pattern has set the Ethereum price on a recovery track. By press time, the coin price trades at $1904, with an insignificant intraday loss of 0.18%.
If bullish momentum persists, the ETH price could rise to $2020 or $2120 levels combined with the 32.8% and 50% Fibonacci extension levels. This technical tool allows traders to identify potential price targets or areas of interest in a trending market.
However, concerning the length of the recent correction, a successful flip above $2120 will hint at the resumption of the prevailing recovery rally and push the ETH price to $2500(100% FIB).
Will Ethereum Price Rise to $2500?
Completion of the wedge pattern is an early sign of recovery for the Ethereum price. However, to reach the $2500 mark, this altcoin will need a 30% rally which is less likely this month, as the current market sentiment is still uncertain. While the aforementioned target may reach gradually the coin holders should keep a close watch on the following hurdles of $1920, $2020, $2138, and $2340. A breakout from each of these barriers may offer a new entry opportunity to interested traders.
- Relative Strength Index: The daily RSI slope(57%) will give a significant confirmation for aggressive bullish if breach the 60% after wavering lower for the past six weeks.
- Exponential Moving Average: A breakdown below the dynamic support of 20-and-50-day EMAs will signal the invalidation of the bullish thesis mentioned above.
Play 10,000+ Casino Games at BC Game with Ease
- Instant Deposits And Withdrawals
- Crypto Casino And Sports Betting
- Exclusive Bonuses And Rewards


Why Trust CoinGape
CoinGape has covered the cryptocurrency industry since 2017, aiming to provide informative insights Read more…to our readers. Our journal analysts bring years of experience in market analysis and blockchain technology to ensure factual accuracy and balanced reporting. By following our Editorial Policy, our writers verify every source, fact-check each story, rely on reputable sources, and attribute quotes and media correctly. We also follow a rigorous Review Methodology when evaluating exchanges and tools. From emerging blockchain projects and coin launches to industry events and technical developments, we cover all facets of the digital asset space with unwavering commitment to timely, relevant information.

Related Articles


- BTC Price Bounces as Spot Investors Buy The Dip Amid Iran War Jitters
- CFTC Chief Mike Selig Signals US Crypto Perpetual Futures Rollout in Coming Weeks
- Fed Rate Cut Odds Drop as Inflation Fears Rise Due To U.S. Iran Conflict
- Here’s Why Tether Gold (XAUt) Price Is Falling Even With Growing Gold Demand
- XRP News: Ripple Expands Payments Platform To Unify Fiat and Stablecoins Globally
- Gold Price Prediction March 2026: Rally, Crash, or Record Highs?
- RIOT Stock Prediction as Needham, Piper Sandler Slash Target After Earnings
- Cardano Price Outlook As Charles Hoskinson Warns Over CLARITY Act
- Circle Stock Price Climbs 15% to $96, Can Rally Continue in March 2026?
- Bitcoin Price Prediction as US-Iran War Enters 4th Consecutive Day
- Top 5 Historical Reasons Dogecoin Price Is Not Rising


