 Buy $GGs
Ethereum Price Hits Historical Liquidity Reset — Is a Bounce Coming?


Highlights
- Liquidity reset repeats a historical pattern that shaped earlier Ethereum market floors.
- ETH trades inside a tightening descending wedge with resistance at $3,206 and $3,607.
- MFI holds mid-range, showing steady inflow strength ahead of a possible breakout.
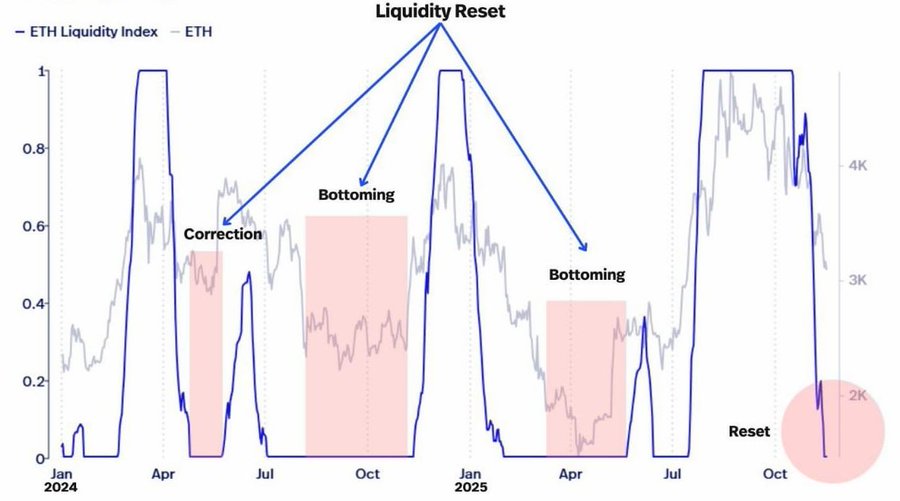
The Ethereum price now trades inside a zone that shaped important turning points in earlier cycles. Liquidity reset signals show the same sharp drop that preceded strong recoveries. ETH moves inside a tightening structure as both sides react near familiar levels. Market depth thins again and forces price to behave more aggressively during each swing. This creates a setup where direction forms quickly once liquidity begins to rebuild from the lower boundary.
Ethereum Price Liquidity Reset Shows Strong Parallels to Earlier Cycle Floors
Liquidity data now signals a full reset that mirrors earlier historical bottom zones with striking accuracy. Each previous drop in liquidity produced strong reactions once depth began improving again.
The ETH market value trades near $3,019 while the market absorbs this fresh reset stage. ETH now moves around zones that triggered major reversals earlier in the year, and this draws renewed interest from buyers. Many participants responded quickly at these same reset pockets in past cycles, and similar behavior may appear here as well.
The Ethereum price now interacts with levels where thinning depth forces sharper compression across the chart. This compression narrows movement and increases the probability of strong direction once depth returns.
Reset pockets rarely remain quiet for long because participants act quickly after the market displays early rebuilding signs. The latest reset places ETH at a familiar technical floor where decisive activity often emerges without delay.
Traders respond to this environment because earlier cycles displayed clear shifts from identical structures. These parallels give the market a strong reason to pay attention as ETH approaches another possible turning phase.
Descending Wedge Forms a Tight and Clear Technical Roadmap
The chart shows ETH trading inside a descending wedge that has guided price action for several weeks. The ETH price touches the wedge floor near $2,930 and reacts with steady buy-side strength during each test.
Sellers continue to defend the declining upper boundary, and the space between both lines keeps shrinking with every swing. This tightening pattern increases pressure inside the wedge and reduces space for sideways movement. Immediate resistance sits at $3,206, while a stronger barrier stands at $3,607, and ETH must clear both before buyers gain broader control.
The Ethereum price forms a cleaner roadmap because wedge structures often break once the boundaries compress tightly. The MFI now sits near mid-range and shows stable inflow strength rather than exhaustion or weakness. This position encourages a potential breakout attempt if ETH lifts above the descending trendline.
The long-term ETH price outlook improves quickly once candle bodies close above the wedge ceiling because the path opens toward $4,244. A successful breakout gives ETH enough room to target $4,800 as the chart regains a healthier structure and stronger upward rhythm.
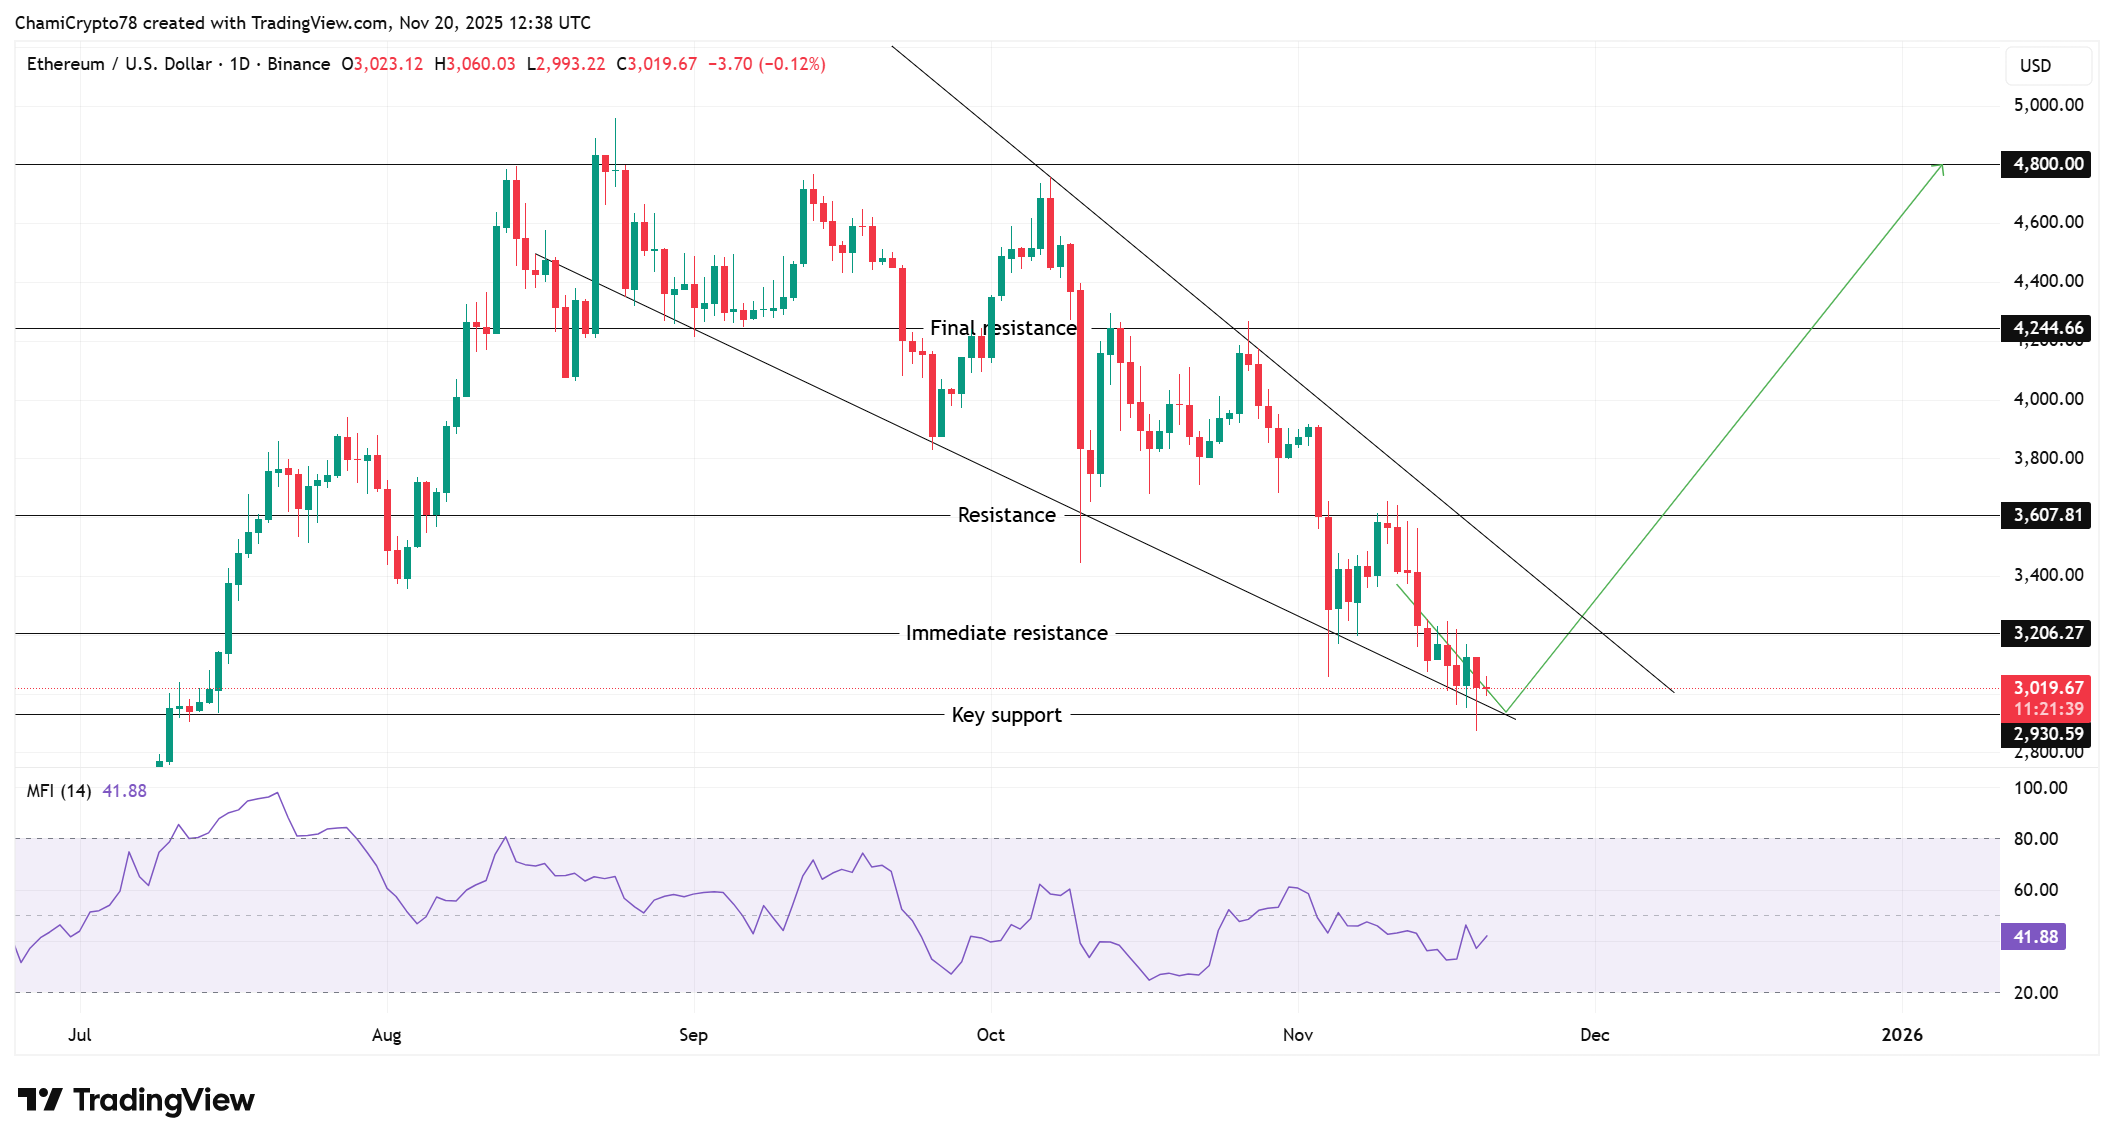
To sum up, the Ethereum price now trades near a zone that shapes direction quickly. ETH respects the wedge floor while approaching a point where compression forces a stronger move. A clean break above $3,206 opens the road toward the mid-range area at $3,607, and eventually $4800. Failure to break the upper wedge wall keeps ETH near support and delays any stronger recovery phase.
Play 10,000+ Casino Games at BC Game with Ease
- Instant Deposits And Withdrawals
- Crypto Casino And Sports Betting
- Exclusive Bonuses And Rewards

Frequently Asked Questions (FAQs)
1. What does a liquidity reset indicate for Ethereum?
2. Why does the descending wedge matter for ETH?
3. What role does MFI play in Ethereum analysis?

Why Trust CoinGape
CoinGape has covered the cryptocurrency industry since 2017, aiming to provide informative insights Read more…to our readers. Our journal analysts bring years of experience in market analysis and blockchain technology to ensure factual accuracy and balanced reporting. By following our Editorial Policy, our writers verify every source, fact-check each story, rely on reputable sources, and attribute quotes and media correctly. We also follow a rigorous Review Methodology when evaluating exchanges and tools. From emerging blockchain projects and coin launches to industry events and technical developments, we cover all facets of the digital asset space with unwavering commitment to timely, relevant information.

Related Articles


- Goldman Sachs CEO Predicts ‘Weeks’ of Crypto Market Crash as U.S Iran War Continues
- Polymarket Axes ‘Nuclear Detonation’ Prediction Market Amid Public Fury
- Indiana Signs Bitcoin Bill Into Law Allowing Crypto in Retirement Plans
- ‘Time to Act Is Now’: CFTC Chief Pushes Swift Passage of CLARITY Act
- Trump Tells Congress to Pass Crypto Market Bill ‘ASAP,’ Blasts Banks for Stalling
- Gold Price Prediction March 2026: Rally, Crash, or Record Highs?
- RIOT Stock Prediction as Needham, Piper Sandler Slash Target After Earnings
- Cardano Price Outlook As Charles Hoskinson Warns Over CLARITY Act
- Circle Stock Price Climbs 15% to $96, Can Rally Continue in March 2026?
- Bitcoin Price Prediction as US-Iran War Enters 4th Consecutive Day
- Top 5 Historical Reasons Dogecoin Price Is Not Rising


