 Buy $GGs
Ethereum Price Prediction: Emerging Pattern May Guide $ETH Recovery to $2000


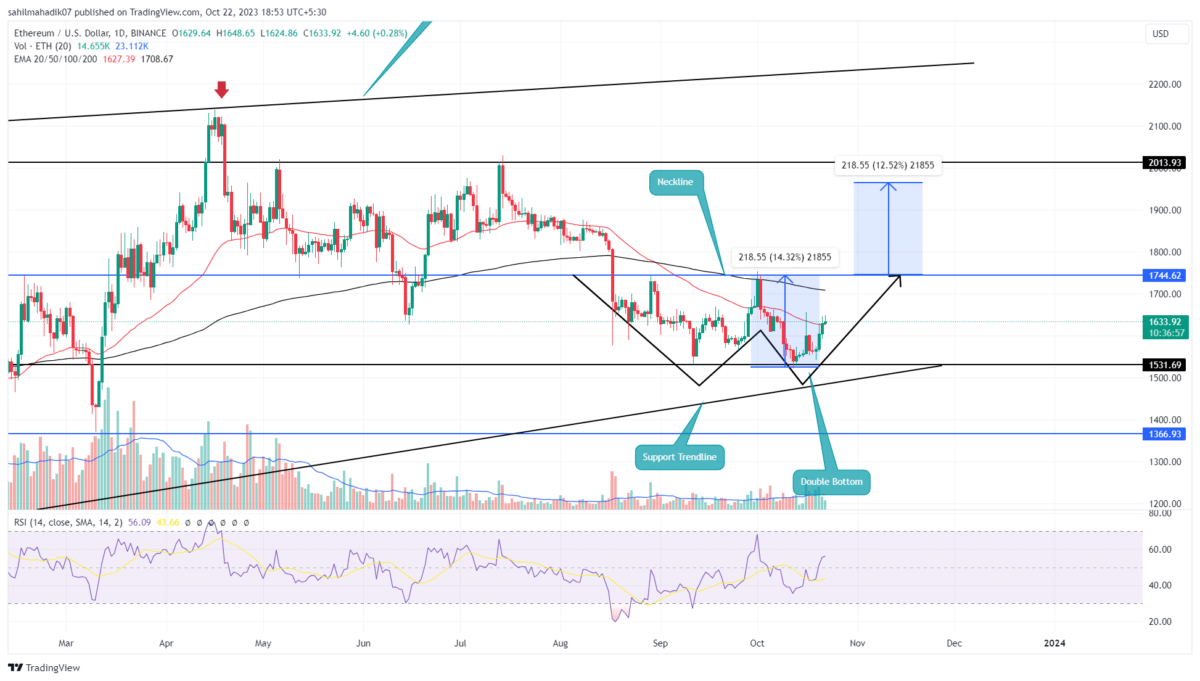
The Ethereum (ETH) price shows a newfound recovery after bouncing off the $1,530 support level on October 14. This bullish reversal represents a 6.6% increase within two weeks, bringing the coin’s current trading price to $1,628. A closer look at the daily time frame suggests that this upswing could be part of a bullish reversal pattern known as a Double Bottom.
Also Read: Elevated US Treasury Yield Is Hurting Ethereum More Than Bitcoin, Here’s Why
Bullish Pattern Hints Upcoming Recovery
- The formation of a double-bottom pattern set the ETH price for a significant rally ahead
- Multiple support at $1500 indicates a high accumulation zone for traders
- The intraday trading volume in Ether is $6.6 Billion, indicating a 34% gain.
 Source- Tradingview
Over the past two months, the Ethereum price has been caught in a consolidation range between $1,745 and $1,535. While the short-term trend indicates sideways movement, these specific levels are significant as they contribute to the formation of a double-bottom pattern. Historically, such patterns occurring at key technical supports have often led to significant upswings.
As of press time, the ETH price is trading at $1,630 and faces resistance at the $1,650 level, as evidenced by a high-wick rejection candle on the daily chart. A daily candle close above this minor resistance could propel the ongoing recovery by another 5.2%, challenging the pattern’s neckline at $1,745.
Breaking above this crucial resistance would provide more reliable confirmation of a sustained recovery, potentially pushing the price up to the $2,000 mark, a gain of approximately 14.5%.
[converter id=”eth-ethereum” url=”https://coingape.com/price/converter/eth-to-usd/?amount=1″]
Will ETH Price Hold $1500 Support?
While the near-term outlook for the ETH price appears bullish, it’s important to note that the existing corrective trend remains in place until the price breaks above the last swing high of $1,745. Should the ongoing rally face supply pressure at this neckline resistance, the prices could experience another rejection, leading to a continuation of the sideways trend. However, a long-coming support trendline currently hovers around the $1,500 mark and offers coin holders a safety net against major corrections.
Play 10,000+ Casino Games at BC Game with Ease
- Instant Deposits And Withdrawals
- Crypto Casino And Sports Betting
- Exclusive Bonuses And Rewards


Why Trust CoinGape
CoinGape has covered the cryptocurrency industry since 2017, aiming to provide informative insights Read more…to our readers. Our journal analysts bring years of experience in market analysis and blockchain technology to ensure factual accuracy and balanced reporting. By following our Editorial Policy, our writers verify every source, fact-check each story, rely on reputable sources, and attribute quotes and media correctly. We also follow a rigorous Review Methodology when evaluating exchanges and tools. From emerging blockchain projects and coin launches to industry events and technical developments, we cover all facets of the digital asset space with unwavering commitment to timely, relevant information.
24 Hours volume
$19.31B
Market Cap
$245.04B
Max Supply
NA

Related Articles


- Senate Eyes CLARITY Act Markup This Month as Banks, Crypto Continue Stablecoin Yield Talks
- Why XRP Price Rising Today? (2 March)
- Breaking: Bitcoin Price Rises to $70k as Gold Crashes Amid U.S.-Iran Conflict
- Bitcoin News: Anthony Pompliano’s ProCap Buys 450 BTC, Gold Bug Peter Schiff Reacts
- Fed Rate Cuts More Likely If U.S.-Iran Conflict Extends, Arthur Hayes Predicts
- Top 5 Historical Reasons Dogecoin Price Is Not Rising
- Pi Coin Price Prediction for March 2026 Amid Network Upgrade, KYC Boost, Rewards Distribution
- Gold Price Nears ATH; Silver Eyes $100 Breakout on Us- Iran War
- Bitcoin And XRP Price As US Kills Iran Supreme Leader- Is A Crypto Crash Ahead?
- Gold Price Prediction 2026: Analysts Expect Gold to Reach $6,300 This Year
- Circle (CRCL) Stock Price Prediction as Today is the CLARITY Act Deadline


