Ethereum Price Prediction: $ETH Price Dips to Multi-Month Support; Best Time To Accumulate?

Ethereum Price Prediction: June has been a challenging month for Ethereum holders, as the altcoin has witnessed a sharp decline of nearly 15% in market value over the past two weeks. Amidst this downturn, Ethereum’s price has recently reached a low of $1624.65, finding support at a long-established trendline. This dynamic support has played a crucial role in sustaining an uptrend for ETH price over the past seven months. Now the question arises: Can buyers initiate a new recovery rally from this point?
Also Read: Ethereum Leads, Hedera’s Revenue Surges Nearly 500%: Messari’s Q1’23 Report
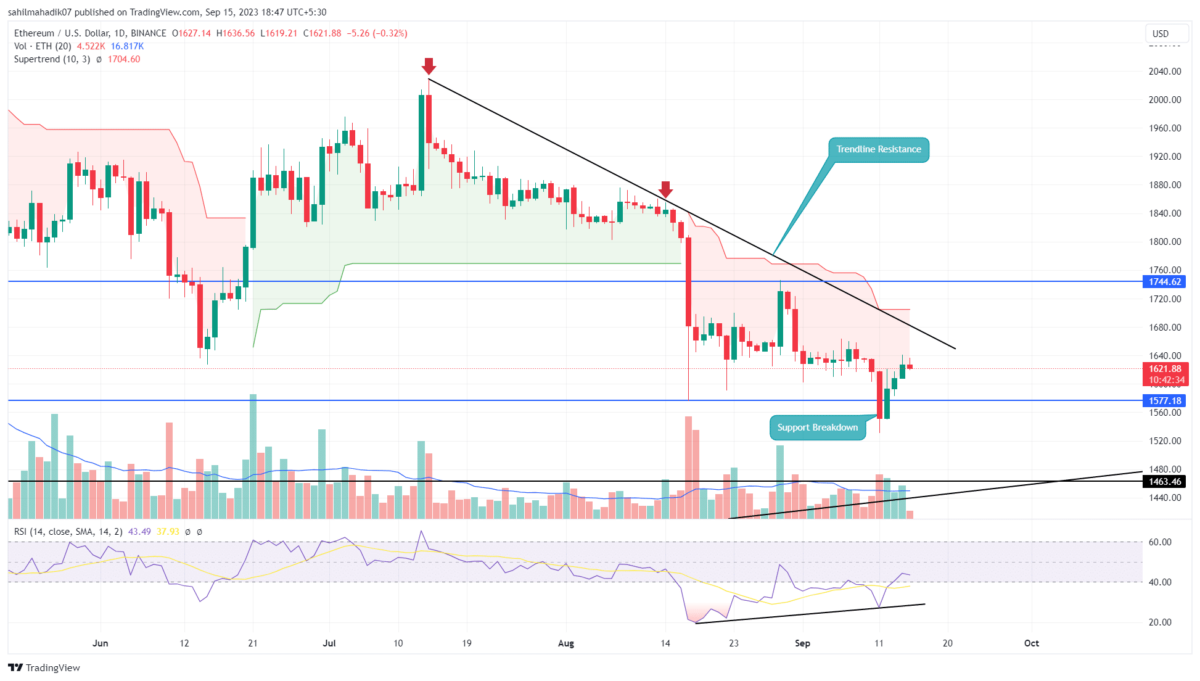
Ethereum Price Daily Chart
- A bullish reversal from the ascending trendline could replenish the bullish momentum in ETH
- The 100-and-200-day EMA moving near $1775 and $1700 increases the resistance power of these levels.
- The intraday trading volume in Ether is $5.8 Billion, indicating a 37.5% loss.
 Source-tradingview
Recent Reversal and Buying Opportunity:
The falling Ethereum price has found reliable support at the ascending trendline of the daily chart. Historical data reveals that the price has rebounded from this support trendline on three occasions, suggesting active accumulation by buyers during dips.
On June 15th, the ETH price rebounded from the rising trendline, experiencing a 2.3% surge and reaching a current trading level of $1668. This reversal presents another opportunity for buyers to capitalize on the dip, with a suggested stop loss set at $1625.
Should the coin price maintain sustainability above the trendline, buyers could gradually drive a recovery above the $2140 peak.
Can $ETH Price Revisit the $2140?
A retest of the long-established support trendline holds a high probability of reigniting a bullish momentum, leading to a new recovery phase. However, for traders seeking a safer entry point, waiting for a breakout above a significant resistance level is advisable. A potential breakout beyond the $1775 barrier would offer buyers additional confirmation of a bullish recovery, potentially driving the price toward the previous swing high of $2138.
- Relative Strength Index: The RSI slope on the daily timeframe currently slopes below 40%, indicating a high bearish momentum. Traders can wait for a breakout above $1775 to gain a stronger edge in their decision-making process.
- Exponential Moving Average: t a bearish crossover between the 20-day and 100-day EMAs could further intensify selling pressure in the market.
- Cathie Wood’s Ark Invest Files for BTC, ETH, SOL, XRP, ADA Crypto Index ETF
- Crypto ETF Issuer Grayscale Files S-1 for Binance Coin (BNB) ETF With SEC
- Did GameStop (GME) Capitulate? Retailer Moves All Bitcoin Holdings to Coinbase in Potential Sell-Off
- Binance Applies For EU MiCA License In Greece
- Kansas Advances Bitcoin Reserve Proposal as States Explore Digital Asset Funds
- Bitcoin and Gold Outlook 2026: Warsh, Rieder Gain Traction in Trump’s Fed Pick
- PEPE Coin Price Eyes 45% Rebound as Buyers Regain Control on Spot Markets
- Pi Network Price Prediction: Will PI Coin Hold Steady at $0.18 Retrace Lower?
- Dogecoin Price Prediction as 21Shares Announces DOGE ETF
- GME Stock Price Outlook as CEO Ryan Cohen Buys Shares Amid Store Closures
- Bitcoin Price Outlook as US Senate Delays CLARITY Act Again


