Ethereum Price Prediction: ETH Price to Hit $1500 if Buyers Lose this Key Support

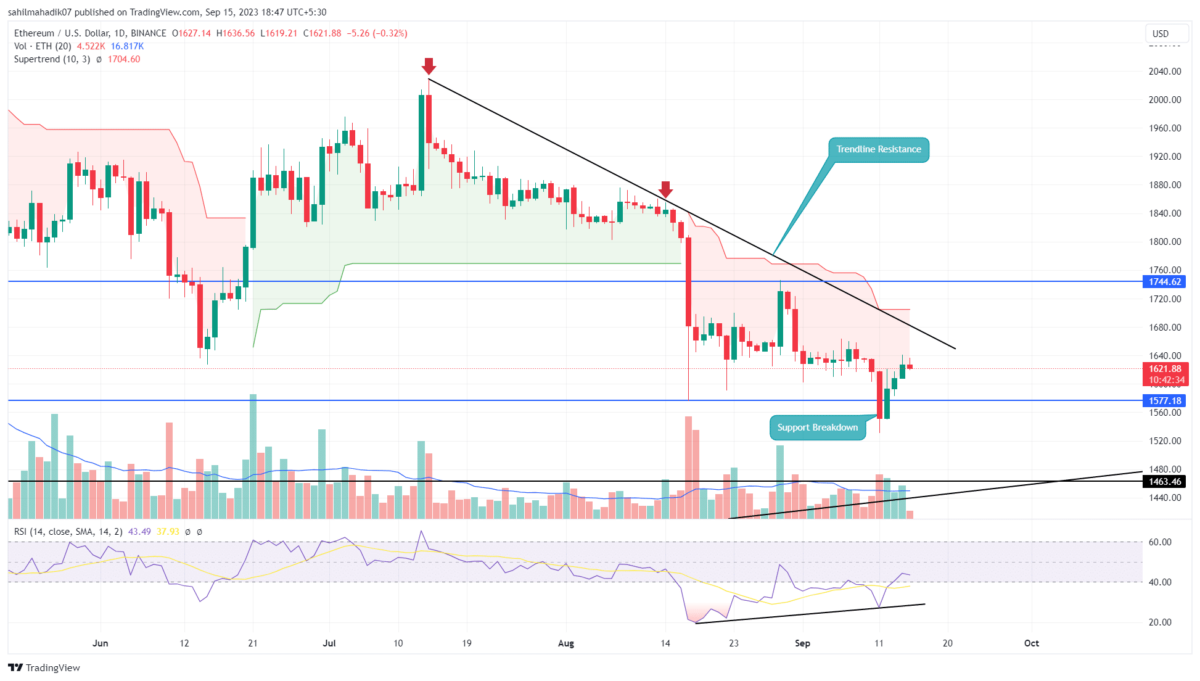
During the aggressive sell-off in mid-August, the Ethereum price showed a bearish breakdown from the support trendline of the channel pattern. Losing the support which carried a bullish trend for nine months, reflects this coin is at risk of an extended correction. However, the falling price halted at 200 EMA slope around $1620 reflecting the buyers’ push to hold higher prices. Will this support bolster the continuation of the prior downtrend?
Also Read: End Of “Goerli” As Ethereum Clients Release Updates For Holesky Testnet
Ethereum Daily Chart: Key Points
- The Ethereum price may remain at risk of longer correction if the ETH price is unable to rebound from 200 weekly EMA
- A breakdown below 200 EMA will trigger a sharp 10% drop in the near term
- The intraday trading volume in Ether is $4.8 Billion, indicating a 30% loss.

Despite a high momentum breakdown from the channel pattern, the ETH sellers failed to offer a suitable follow up reflecting a lack of conviction in bears. Moreover, the weekly chart showed long-wick rejection candles at 200-day EMA as a sign of active accumulation.
The 200-day EMA is an important technical tool that segregates between the bullish or bearish sentiment in the market. Historically, this EMA slope has acted as major support or resistance and an important turning point in the market.
Considering the bearish momentum in the market, the Ether price should give a weekly candle closing above the aforementioned support to get a better confirmation for downtrend continuation.
The post-break fall may have plunged the price to $1500, followed by $1366.
[converter id=”eth-ethereum” url=”https://coingape.com/price/converter/eth-to-usd/?amount=1″]
Here’s how ETH Price may restore a bullish trend.
While the bearish momentum seems valid for the ETH price, the increasing demand pressure at EMA support could offer a significant bounceback. However, the potential upswing must surpass the aforementioned breakdown high of $1800 to get better confirmation of recovery.
- Relative Strength Index: A downtick in the daily RSI slope reflects the selling momentum is active.
- Exponential Moving Average: A bearish crossover between the 20-and-50 weekly EMAs would bolster sellers for a prolonged downfall.
- Bitmine ETH Position Bleeds Billions As Ethereum Struggles to Hold $2k
- Crypto Market Crash Deepens as Bitcoin Falls to $70K amid Bear Market Jitters
- CLARITY Act: Crypto Firms Propose New Changes to Advance Stalled Market Bill
- Binance Denies Fake Cease-and-Desist Claim Amid Bankruptcy Rumors
- Bitcoin Crashes to $72k as U.S.–Iran Tensions Rise After Talks Collapse
- Dogecoin Price Prediction After SpaceX Dogecoin-Funded Mission Launch in 2027
- Solana Price Crashes Below $95 for the First Time Since 2024: How Low Will SOL Go Next?
- Ethereum Price Eyes a Rebound to $3,000 as Vitalik Buterin Issues a Warning on Layer-2s
- Pi Network Price Outlook as Bitcoin Faces a Strong Sell-Off Below $80k
- Bitcoin Price Prediction As US House Passes Government Funding Bill to End Shutdown
- Ondo Price Prediction as MetaMask Integrates 200+ Tokenized U.S. Stocks


