
Ethereum Price Prediction: How Long till $ETH Price Stays in a Sideways Trend?


Ethereum Price Prediction: The U.S. Securities and Exchange Commission’s (SEC) action against major cryptocurrency exchanges Binance and Coinbase (COIN) has created indecisiveness among traders. Similar to a majority of major cryptocurrencies, the Ethereum price turned sideways and is now consolidating in a narrow range. The potential traders can use this range to determine the future potential for this altcoin.
Also Read: Will Ethereum Price Break $10k? VanEck Predicts $ETH Price To Reach $11.8k By 2030
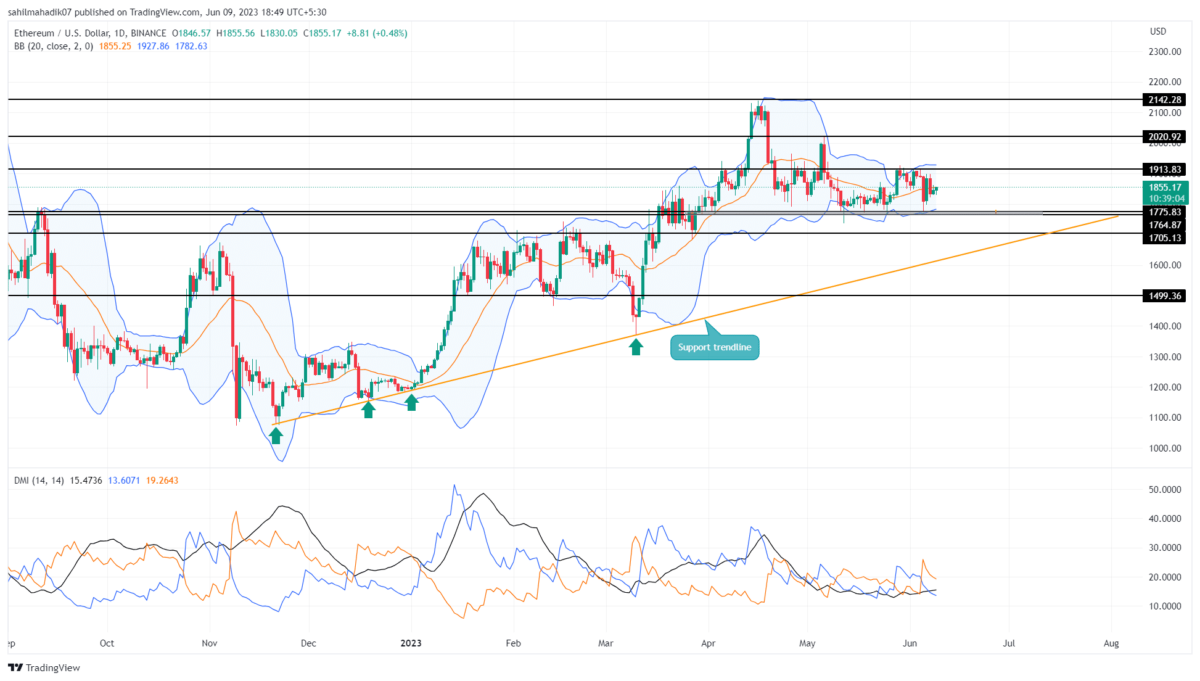
Ethereum Price Daily Chart
- The Ethereum fear and greed index at 49% reflect a neutral sentiment in the market
- Under the influence of the rising support trendline, the ETH price remains bullish in the long term
- The intraday trading volume in Ether is $4.47 Billion, indicating a 29% gain.
 Source- Tradingview
Despite the June 5th sell-off, the Ethereum price managed to rebound from the muti-month support of $1775 indicating the buyers continue to defend this level. On the flip side, the coin price has recently formed a new lower high of $1915 in its existing downtrend creating a major resistance.
The aforementioned level can greatly influence the ETH price and thus created a narrow range. By the press time, this altcoin trades at $1847, with an intraday gain of 0.1%. So far the coin projects no dominance from buyers and sellers for trend control, suggesting the sideways trend is likely to continue for a few more sessions.
Thus, if the market trend turns bearish, a breakdown below $1775 may plunge the prices below $1700 to meet the long-coming support trendline.
Anyhow, a breakout above $1915 will sign an early sign of a trend change.
Will the Ethereum Price Rise to $2000?
If the crypto market showed no improvement in its sentiment, the Ethereum price could carry this range for a week or two. Only a breakout from either level of this range could offer trades a better conviction for potential trends. A possible breakout above $1915 could boost the buying pressure and surge prices above $2000.
- Directional Movement Index: A bearish alignment in which the DI-(orange) slope stays above and DI+(blue) reflects market sentiment in the current negative.
- Bollinger Band: The bands of the BB indicator moving sideways highlight high volatility in the market.
Play 10,000+ Casino Games at BC Game with Ease
- Instant Deposits And Withdrawals
- Crypto Casino And Sports Betting
- Exclusive Bonuses And Rewards


Why Trust CoinGape
CoinGape has covered the cryptocurrency industry since 2017, aiming to provide informative insights Read more…to our readers. Our journal analysts bring years of experience in market analysis and blockchain technology to ensure factual accuracy and balanced reporting. By following our Editorial Policy, our writers verify every source, fact-check each story, rely on reputable sources, and attribute quotes and media correctly. We also follow a rigorous Review Methodology when evaluating exchanges and tools. From emerging blockchain projects and coin launches to industry events and technical developments, we cover all facets of the digital asset space with unwavering commitment to timely, relevant information.


- FUNToken Launches First Mobile Game “Bounce Helix” on Android
- Breaking: Citigroup Cuts Bitcoin and Ethereum Price Targets amid CLARITY Act Delays
- Breaking: Bitcoin Treasury Metaplanet Moves 4986 BTC, Stock Price Tanks 12%
- Ripple News: XRPL Breaks Records with 7.7M Users Amid XRP Price Rally
- Argentina Bans Crypto Prediction Platform Polymarket for Illegal Gambling, Follows Colombia
- Bitcoin Price Forecast: Will BTC Break $80k Ahead of Fed Decision Today?
- MSTR Stock Prediction as Strategy Makes Largest Bitcoin Purchase in 2026 and Analyst Targets BTC Price $100K
- Pi Network Price Prediction After Smart Contract and Second Migration Launch
- Pepe Coin Price Surges 20%- How High Can it Go in March?
- Is XRP Price Gearing Up For $2 Level As BTC Rebounds Above $74k?
- Cardano’s $0.50 Resistance- Can “Midnight” Alpha Defy the Fog of War?


