 Buy $GGs
Ethereum Price Prediction: What’s Next, $1500 Or $1700?


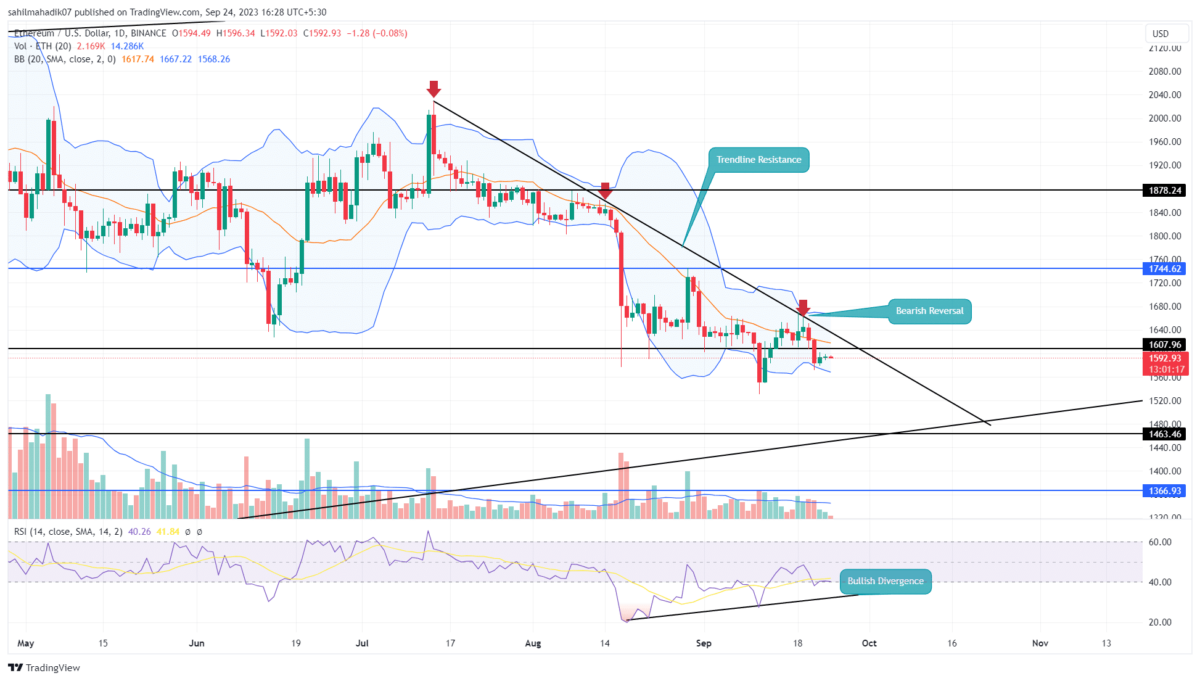
On September 19th, the rising ETH price faced a roadblock at the $1660 level and formed a bearish reversal pattern known as the “Evening Star.” This particular setback marked the third time Ether reverted from a downsloping resistance trendline that dictated its price trajectory for over two months. Given this consistent pattern, the ongoing downtrend looks set to persist, with potential further drop on the horizon.
Also Read: Ethereum Network Fees Hits Yearly Lows; Is the Bottom In?
Will Ether Rise Back to $1700?
- The ETH price faces dynamic resistance from a falling trendline.
- A breakdown below $1610 support sets a potential fall to $1500
- The intraday trading volume in Ether is $1.9 Billion, indicating a 33% loss
 Source- Tradingview
From last week’s high of $1669, the Ethereum price fell 4.5% to reach the current trading price of $1593. This descent breached the local support of $1610 projecting the sellers’ intent to drive the price down further.
Yet, the lack of a significant follow-through after this drop suggests a waning bearish momentum. Consequently, the coin sees a slight uptick, potentially retesting the overhead resistance trendline.
Should this occur, it provides buyers an opportunity to break this barrier, hoping to ignite a fresh recovery phase. This upside breakout with a daily candle closure, could propel ETH price value by around 8%, targeting the $1744 mark.
[converter id=”eth-ethereum” url=”https://coingape.com/price/converter/eth-to-usd/?amount=1″]
ETH vs BTC Performance
 Source: Coingape| Ethereum Vs Bitcoin Price
When analysing the past quarter’s price behaviour, the Ethereum coin appears to be underperforming when compared to the Bitcoin price. The recovery attempts by ETH bulls tend to be subdued, while the price corrections have been more pronounced. Given this pattern of price behavior, investors should approach with caution when adding new funds to this altcoin.
- Bollinger Band: A downtick in the lower boundary of Bollinger Band reflects the sellers are currently aggressive.
- Relative Strength Index: The daily RSI slope forming three consecutive higher lows indicates the rising bullish momentum.
Play 10,000+ Casino Games at BC Game with Ease
- Instant Deposits And Withdrawals
- Crypto Casino And Sports Betting
- Exclusive Bonuses And Rewards


Why Trust CoinGape
CoinGape has covered the cryptocurrency industry since 2017, aiming to provide informative insights Read more…to our readers. Our journal analysts bring years of experience in market analysis and blockchain technology to ensure factual accuracy and balanced reporting. By following our Editorial Policy, our writers verify every source, fact-check each story, rely on reputable sources, and attribute quotes and media correctly. We also follow a rigorous Review Methodology when evaluating exchanges and tools. From emerging blockchain projects and coin launches to industry events and technical developments, we cover all facets of the digital asset space with unwavering commitment to timely, relevant information.
24 Hours volume
$17.65B
Market Cap
$244.94B
Max Supply
NA


Related Articles


- Breaking: Trump Says The U.S.-Iran War Could End Soon, Mulls Taking Over Strait Of Hormuz
- Bhutan Dumps More Bitcoin as BTC Price Climbs Amid Falling Oil Prices
- Bitget Upgrades Agent Hub to Enable OpenClaw, Claude Code to Trade Crypto in Real Time
- Why Next Two Weeks Are Do or Die for Crypto Market?
- Breaking: Tom Lee’s BitMine Acquires 60,976 ETH As BMNR Stock Eyes Recovery
- Top Analyst Explains Why Pi Network Price May Soar to $0.50 This Week
- Is MSTR Stock Going to Rally $150?
- Bitcoin And XRP Price Prediction As US Oil Prices Fall Sharply- Will This Spark a New Bull Rally?
- Is It a Good Time to Buy XRP As Price Falls 64% From All-time High
- Will Crypto Market Crash This Week? Analysts Predict Timeline for Volatility
- Gold Price Prediction Ahead of March 18 FOMC Meeting


