 Buy $GGs
Ethereum Price Prediction: Range Breakdown Signals Longer Correction For ETH


Ethereum Price Prediction: The Ethereum(ETH) price consolidated between the $1300 and $1238 levels for nearly a week. However, the sellers benefited from the current market uncertainty and breached the lower support. This range breakdown releases the bearish momentum and triggers a longer price correction.
Key points:
- A bearish reversal from the $1300 resistance may trigger a sideways trend in Ethereum
- The RSI indicator, which accentuates the speed and magnitude of the asset’s recent price, has entered the bearish territory.
- The intraday trading volume in Ether is $6.1 Billion, indicating a 21% gain
 Source- Tradingview
The recent recovery in the crypto market pushed the Ethereum price to a high of $1300. Hitting the psychological resistance, the altcoin triggered a minor pullback and retested the flipped support of $1238.
While the market sentiment remained uncertain, the ETH price continued to wobble between these aforementioned levels and created a narrow range. However, today, the long bearish candle accounted for a 3.35% loss and breached the $1238 support.
The bearish fallout indicates the sellers’ attempt to regain the trend and undermine the recent recovery gains. Furthermore, the Ethereum price currently trades at $1229 and should offer a daily candle closing to confirm this support breakdown.
This development will accelerate the bearish momentum and plunge the prices 6% down to hit $1160 support.
Global In/Out of the Money metric
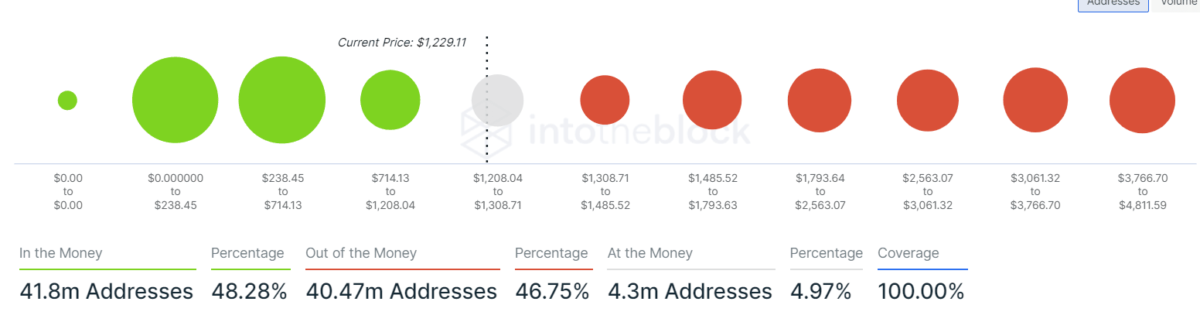 Source- intotheblock
Concerning the current Ethereum price, the Global In/Out of the Money (GIOM) on-chain metric indicates that 48.28% of ETH addresses are in the money and realize profits, whereas 46.75% are out of the money address witnessing losses.
However, the aforementioned levels are quite close to being considered as neutral market sentiment,
The nearest green cluster with a mean value of $1016 indicates an area of accumulation; meanwhile, the red cluster with $1362 accentuates a strong resistance.
Technical Indicator
MACD: the MACD and signal lines narrowing reflect the bullish momentum is losing steam. Moreover, a possible bearish crossover between these slopes offers a sell signal
EMAs: the Ethereum price loses the 20-day support with the recent price drop, offering an additional confirmation for sellers to lead the prices lower.
Ethereum Coin Price Intraday Levels
- Spot rate: $1229
- Trend: Bearish
- Volatility: Medium
- Resistance level- $1300 and $1420
- Support level- $1160 and $1100
Play 10,000+ Casino Games at BC Game with Ease
- Instant Deposits And Withdrawals
- Crypto Casino And Sports Betting
- Exclusive Bonuses And Rewards


Why Trust CoinGape
CoinGape has covered the cryptocurrency industry since 2017, aiming to provide informative insights Read more…to our readers. Our journal analysts bring years of experience in market analysis and blockchain technology to ensure factual accuracy and balanced reporting. By following our Editorial Policy, our writers verify every source, fact-check each story, rely on reputable sources, and attribute quotes and media correctly. We also follow a rigorous Review Methodology when evaluating exchanges and tools. From emerging blockchain projects and coin launches to industry events and technical developments, we cover all facets of the digital asset space with unwavering commitment to timely, relevant information.

Related Articles


- Deutsche Bank-Backed AllUnity Launches First MiCA-Compliant Swiss Franc Stablecoin
- Crypto Market on Edge as US-Iran Hold Talks Ahead of Trump’s War Deadline
- XRP Prepares for Phase 4 Lift-Off, $21.5 Level in Focus
- Vitalik Buterin Exceeds Planned Ethereum Sales as Total Liquidations Hit $35M
- Circle Stock Price Jumps 35% to $83 on Stablecoin Boom, USDC Supply Soars 72%
- XRP Price Outlook As Jane Street Lawsuit Sparks Shift in Morning Sell-Off Trend
- Dogecoin, Cardano, and Chainlink Price Prediction As Crypto Market Rebounds
- Will Solana Price Rally to $100 If Bitcoin Reclaims $72K?
- XRP Price Eye $2 Rebound as On-Chain Data Signals Massive Whale Accumulation
- Ethereum Price Reclaims $2K- New Rally Ahead or a Temporary Bounce?
- COIN Stock Price Prediction as Wall Street Pros Forecast a 62% Surge


