Ethereum Price Prediction: Will $ETH Rebound from $1600 Lead a Fresh Rally?


The largest cryptocurrency Bitcoin obtaining suitable support at $25000 has halted the correction trend in several cryptocurrencies. As a result, the No. 2 digit coin Ether has been receiving demand near $1600. The aforementioned support aligned with a rising support trendline offers a strong footing for buyers to recuperate bullish momentum. Is this enough to go bullish on Ethereum coins?
Also Read: Ethereum Sees $380M Outflow from CEXs; Are Investors Losing Confidence?
Combined Support Assists Buyers Ethereum for Bullish Reversal
- A bearish breakdown from the support trendline will trigger a $10% drop in ETH
- A bullish breakout from overhead resistance will be a sign of trend reversal
- The intraday trading volume in Ether is $2.8 Billion, indicating a 33% loss.
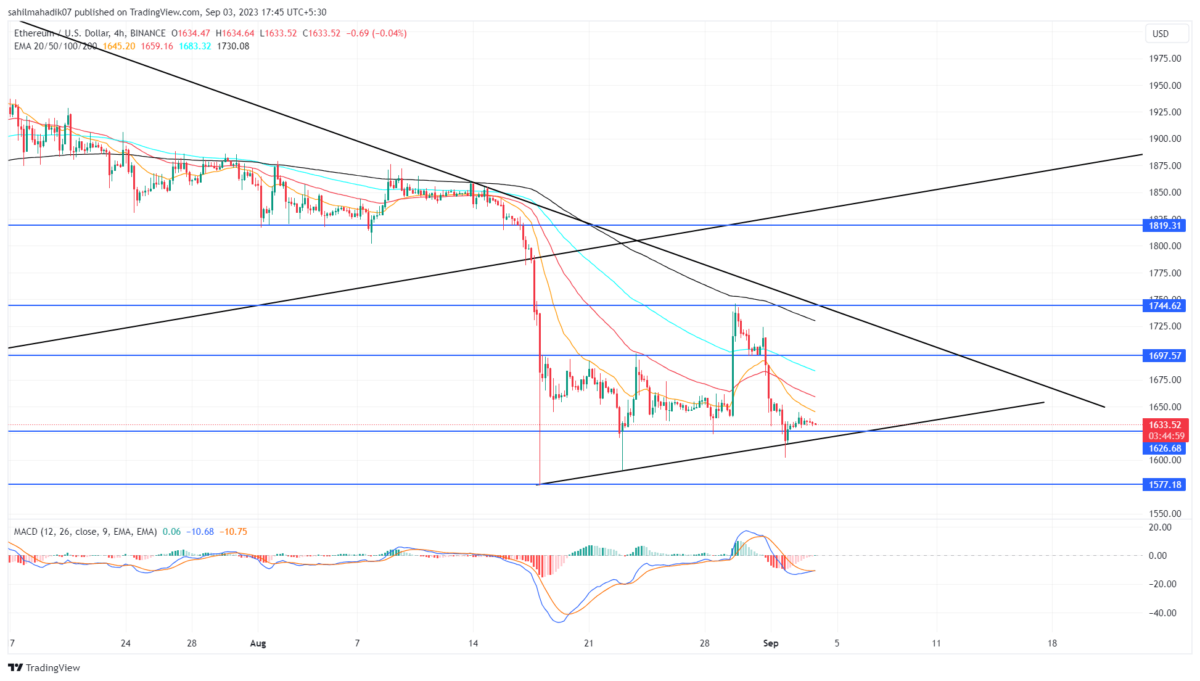
 Source- Tradingview
Amid the recent downturn in the crypto market, the ETH price has witnessed strong supply pressure in the last few days From the last swing high of $1746, the coin price tumbled 7% to currently trade at $1628.
However, a look at the daily time frame chart shows this altcoin is hovering above the combined support of the ascending trendline and $1600. A long-tail rejection from the lower side reflects the demand pressure at the aforementioned support.
If the coin price manages to rebound from this support, the ETH price will likely surge 5.8% to challenge the overhead resistance trendline near $1720
Anyhow, the crypto traders must closely watch the price action at this support. If the prices are unable to rebound in a few days, it would indicate a weakness in buyers’ conviction and a high possibility of further downfall.
A breakdown below the upper support trend will push the Ethereum coin to $1450.
[converter id=”eth-ethereum” url=”https://coingape.com/price/converter/eth-to-usd/?amount=1″]
Here’s How ETH Price May Restore a Bullish Trend.
An overhead trendline is carrying the current correction trend in ETH price. The coin price reverted twice from this resistance already indicating the traders are aggressive nature to sell on the bullish upswing. Therefore, for the coin price to resume a bullish trend the buyers need to break the downsloping resistance.
- Moving Average Convergence Divergence: A potential bullish crossover between the MACD(blue) and signal(orange) reflects underlying growth in bullish momentum.
- Exponential Moving Average: The 200-day EMA may act as dynamic resistance to the current correction trend.

Why Trust CoinGape
CoinGape has covered the cryptocurrency industry since 2017, aiming to provide informative insights Read more…to our readers. Our journal analysts bring years of experience in market analysis and blockchain technology to ensure factual accuracy and balanced reporting. By following our Editorial Policy, our writers verify every source, fact-check each story, rely on reputable sources, and attribute quotes and media correctly. We also follow a rigorous Review Methodology when evaluating exchanges and tools. From emerging blockchain projects and coin launches to industry events and technical developments, we cover all facets of the digital asset space with unwavering commitment to timely, relevant information.

Related Articles


- CLARITY Act: Trump’s Crypto Adviser Says Stablecoin Yield Deal Is “Close” as March 1 Deadline Looms
- Trump Tariffs: U.S. To Impose 10% Global Tariff Following Supreme Court Ruling
- CryptoQuant Flags $54K Bitcoin Risk As Trump Considers Limited Strike On Iran
- Why Is Bitdeer Stock Price Dropping Today?
- Breaking: U.S. Supreme Court Strikes Down Trump Tariffs, BTC Price Rises
- Ethereum Price Rises After SCOTUS Ruling: Here’s Why a Drop to $1,500 is Possible
- Will Pi Network Price See a Surge After the Mainnet Launch Anniversary?
- Bitcoin and XRP Price Prediction As White House Sets March 1st Deadline to Advance Clarity Act
- Top 3 Price Predictions Feb 2026 for Solana, Bitcoin, Pi Network as Odds of Trump Attacking Iran Rise
- Cardano Price Prediction Feb 2026 as Coinbase Accepts ADA as Loan Collateral
- Ripple Prediction: Will Arizona XRP Reserve Boost Price?


