
Ethereum Price Return to $1800? Fake Breakout Triggers Concerns of Minor Correction


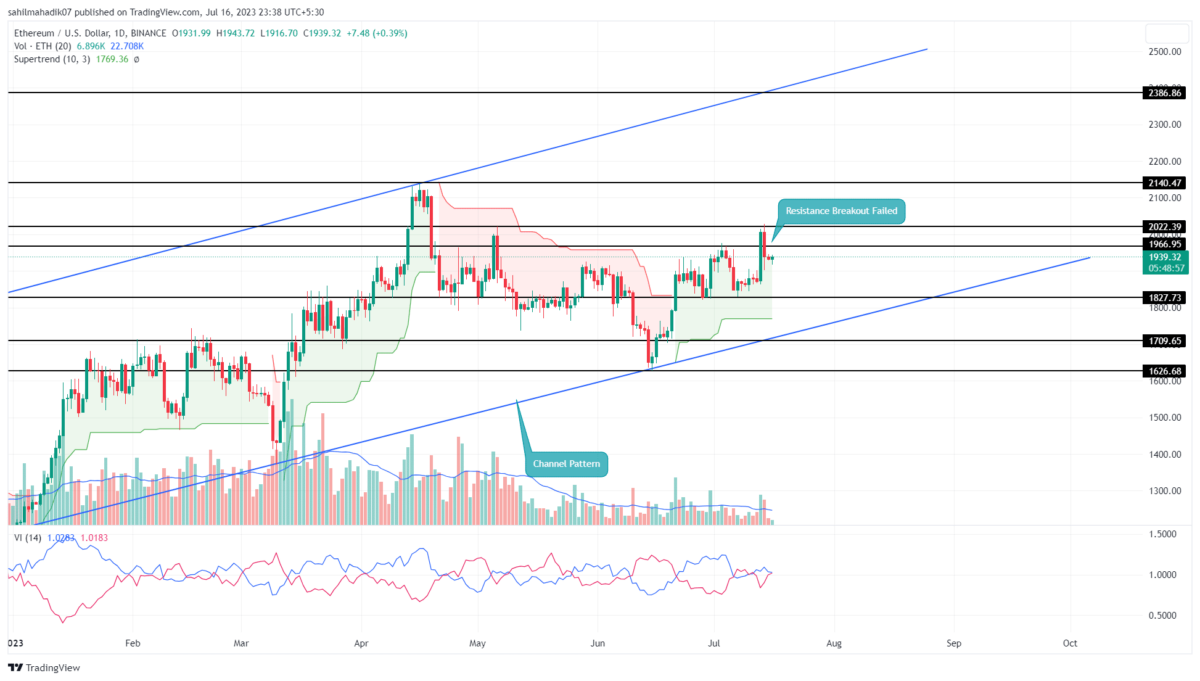
Ethereum Price Analysis: On July 13, the Ethereum coin price breached a weekly resistance of $1966 as a signal of uptrend continuation. However, the coin price faced immediate supply pressure at $$2000 psychological resistance and plunged below 1966. This failed breakout suggests the recent rally was driven by market sentiment and not by the coin’s own strength. Thus, the ETH price could witness a minor pullback before resuming the recovery trend.
Also Read: Bitcoin (BTC) and Ethereum (ETH) Show Bullish Divergence As Per NRPL Indicator, Rally Ahead?
Ethereum Price Daily Chart
- The $2000 stands in a strong resistance zone against buyers
- The rising channel pattern maintains the long-term bull trend in the ETH price
- The intraday trading volume in Ether is $134 Billion, indicating a 134% gain.
 Source- Tradingview
The Ethereum price failure to sustain $1966 must have trapped the hasty buyers who entered the breakout traders. Such bull traps are strong bearish signals as the price usually forces the liquidation of the trapped buyers and brings more selling orders into the market.
By the press time, Ethereum price traded at $1940 with an intraday of 0.43%. If the selling pressure persists, the coin price tumble 7.5% to retest a local support of $1830. Over the past three weeks, this support has offered a dip opportunity to buyers and maintained a recovery rally.
In addition, the ETH price is still in a higher high and higher low state, indicating the bullish trend is intact.
[converter id=”eth-ethereum” url=”https://coingape.com/price/converter/eth-to-usd/?amount=1″]
Will ETH Price Rise to $2400?
The rising channel pattern currently governs the bullish trend in the Ethereum price. The support trendline of this pattern is a suitable level to accumulate and lose the neckline to change sentiment if sellers breached below. Under the influence of this pattern, the current recovery cycle is likely to hit the overhead trendline that is near the $2400 mark.
- Vortex indicator: A possible bearish crossover between the VI+(blue) and Vl(orange)- slope reflects a loss in bullish momentum.
- Super Trend: The green film accentuates the overall market trend is bullish

Why Trust CoinGape
CoinGape has covered the cryptocurrency industry since 2017, aiming to provide informative insights Read more…to our readers. Our journal analysts bring years of experience in market analysis and blockchain technology to ensure factual accuracy and balanced reporting. By following our Editorial Policy, our writers verify every source, fact-check each story, rely on reputable sources, and attribute quotes and media correctly. We also follow a rigorous Review Methodology when evaluating exchanges and tools. From emerging blockchain projects and coin launches to industry events and technical developments, we cover all facets of the digital asset space with unwavering commitment to timely, relevant information.


- 3 Top Reasons Why Coinbase Stock is Sliding Today?
- Bernstein Says Bitcoin Has Bottomed Even as U.S.-Iran Peace Talks Remain Uncertain
- Monero Privacy Demand Hits Record Highs: How GhostSwap Is Meeting the BTC to XMR Surge
- Goldman Sachs Defies Oil Surge with Bold 2026 Fed Rate Cut Forecast
- Bitcoin Risks Fall as US-Israel Strikes Iran’s Energy Facilities Despite Trump’s 5-Day Pause
- Dogecoin, Shiba Inu, and Pepe Coin Price Outlook as Markets Rise on U.S.–Iran Temporary Pause
- Bittensor (TAO) Price Soars 80% MoM Outperforming Bitcoin- Is It A Good Time to Buy?
- Top Factors Behind Shiba Inu (SHIB) Price Surging Today
- Gold Vs BTC: Bitcoin Outperforms Gold by 23% – Is $75K Next Amid Trump’s Five Day Pause
- Crypto Stocks to Watch As Trump Issues 48-Hour Iran Ultimatum- CRCL, COIN, and MSTR Price Analysis
- XRP Price Prediction Ahead of March 27 SEC Spot ETF Decision


