 Buy Presale
Ethereum Price Signals 35% Recovery as ETH/BTC Forms a Bullish Pennant


Highlights
- Ethereum price eyes a 35% rally past $3,500 as the 50-day SMA forms a bullish crossover with the 150-day SMA.
- A bullish pennant on the ETH/BTC chart shows that the ratio could surge by 40% as Ethereum outperforms Bitcoin.
- Surging institutional interest amid Sharplink Gaming purchasing over 176,000 ETH could aid an upward trend.
Ethereum (ETH) is down 7% today, June 13, with a 40% spike in trading volumes that topped $40 billion within 24 hours as traders looked to offload their coins amid concerns over Israel and Iran. Despite the drop, a bullish cross on the Ethereum price chart signals a potential 35% recovery as ETH/BTC forms a bullish pennant, signalling it could soon outperform Bitcoin (BTC).
At press time, ETH price trades at $2,437 after falling from its daily high of $2,770. Per Coinglass data, Ethereum liquidations reached $294 million within 24 hours, with most of the liquidated positions being from long traders.
Ethereum Price Eyes 35% Recovery Amid Bullish Crossover
Ethereum price eyes a 35% recovery according to the bullish formation on the daily timeframe chart. This recovery could occur if historical trends align and a bullish crossover has the same impact that it did in the past.
The 50-day moving average (SMA) has crossed above the 150-day SMA, which signals that the short-term momentum is gaining strength. The crossover implies that buy-side pressure is gaining strength and may tilt the trend upwards.
Past data shows that each time this crossover occurred, the price of Ethereum recorded a notable price surge. In November 2024, this SMA crossover sparked a 35% rally that pushed Ethereum price from around $3,000 to above $4,000 in weeks. In November 2023, the crossover sparked bigger gains of more than 115%.
If Ethereum price repeats last year’s trend and surges by 35%, it could soar past $3,500. Such a rally is more likely to occur because, besides having a strong technical structure, institutions are also adopting Ethereum after Sharplink Gaming purchased 176,271 ETH.
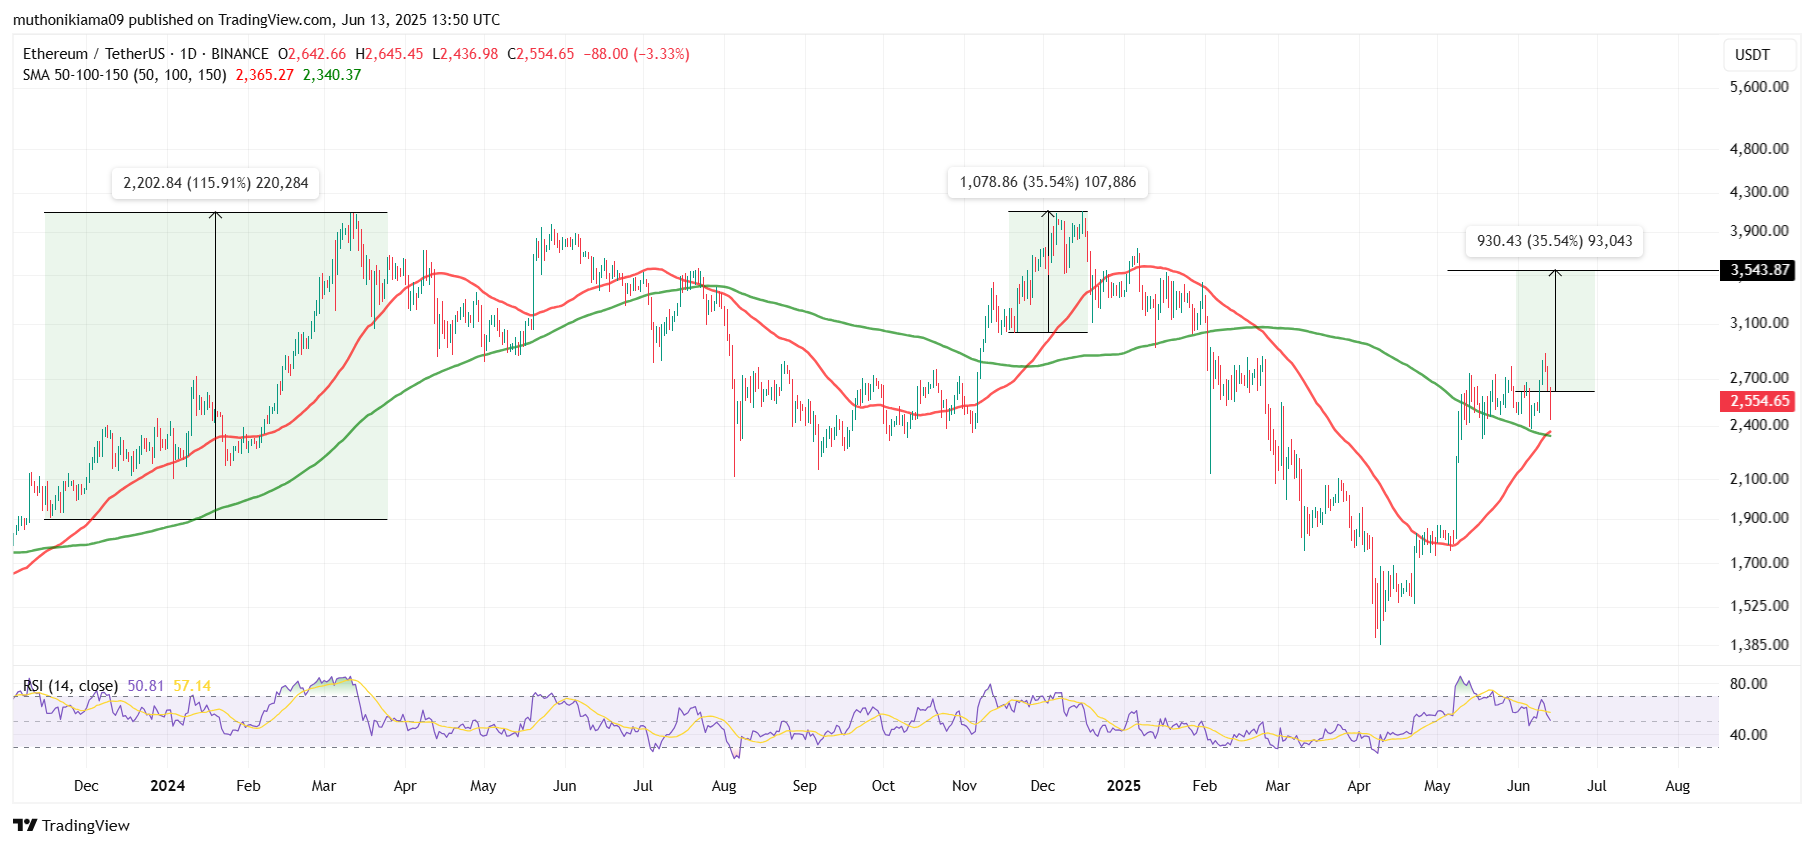
For the above bullish outlook to play out, buyers will have to step into the market, and currently, the buy-side pressure is notably low. The RSI stands at a neutral level of 50 after a sharp decline from the May overbought levels. The RSI has to surge and form higher highs to confirm a strong upward momentum.
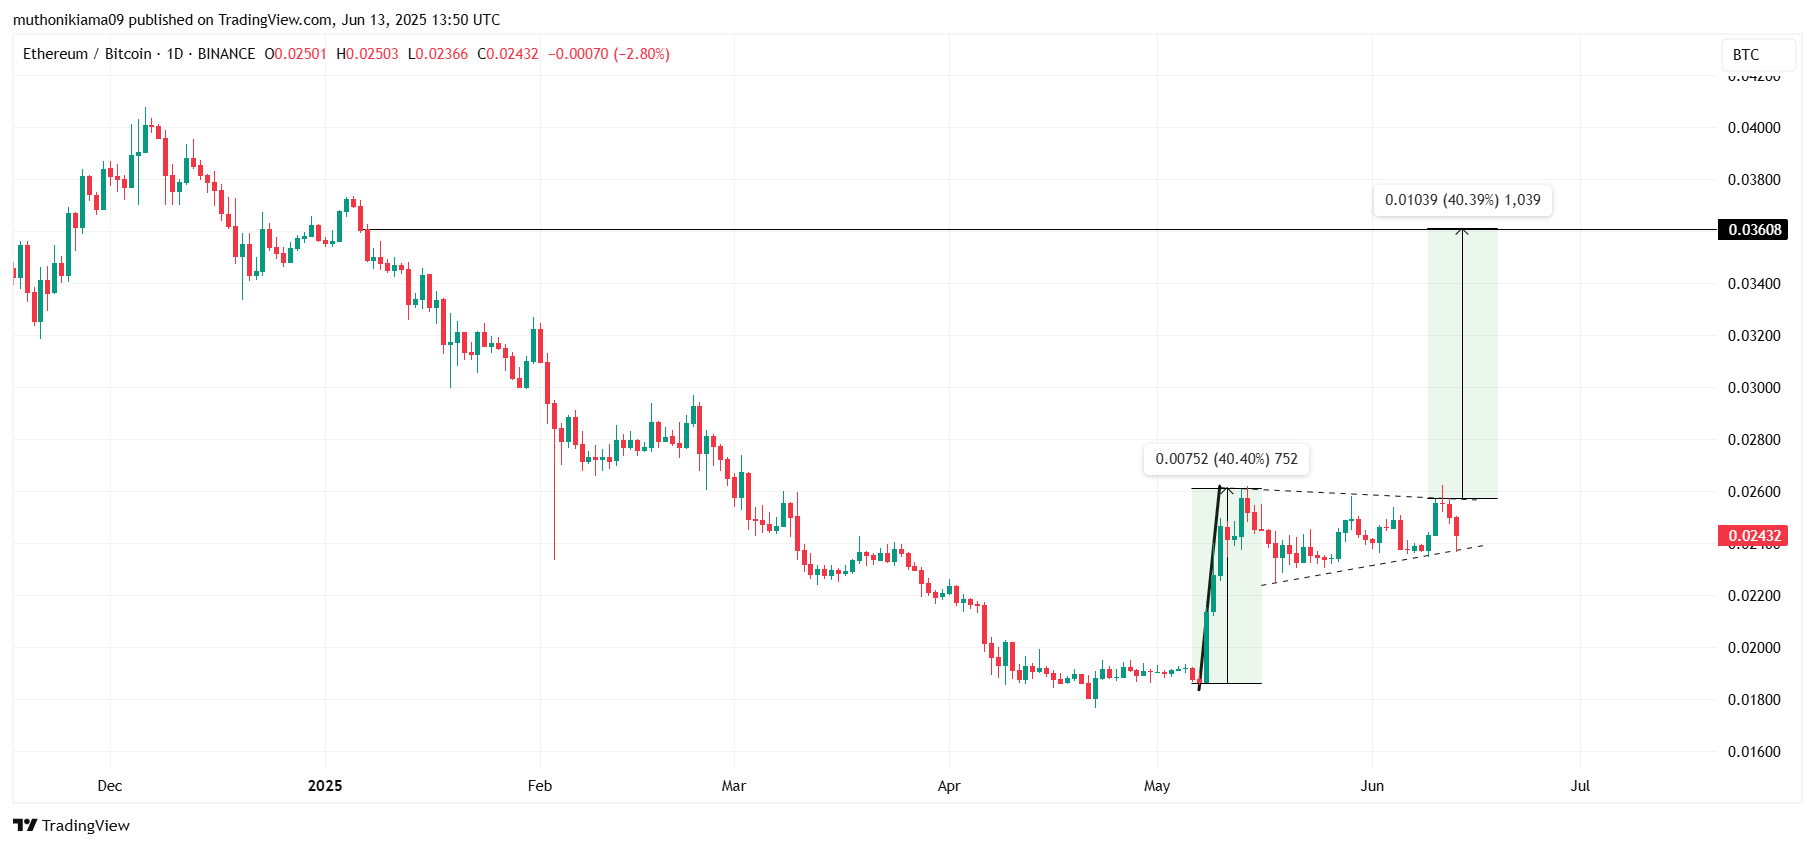
ETH/BTC Forms a Bullish Pennant
Ethereum price is also showing signs of outperforming Bitcoin as the ETH/BTC ratio forms a bullish pennant. This pattern was formed after the initial surge in ETH price in May, which formed the flag pole, before the ratio consolidated within a symmetrical triangle.
The bullish pennant signals that Ethereum’s strength, relative to Bitcoin, paused momentarily before continuing higher. If the ratio confirms a breakout above the upper trendline of the pennant, it will validate the outlook and signal ETH’s renewed strength.
Based on the flagpole’s height, overcoming the upper trendline resistance could trigger a 40% surge to 0.036, the highest level since January 2025. This surge will coincide with a massive Ethereum breakout rally past $3,500.
In conclusion, the Ethereum daily timeframe chart signals that a recovery could be imminent for the largest altcoin. If a bullish SMA crossover triggers a rally like it has done in the past, Ethereum price could surge past $3,500. Moreover, the formation of a bullish pennant on the ETH/BTC chart signals that an upward trend is likely.
With bullish signs aligning on the daily chart, the long-term Ethereum price prediction shows what to expect from ETH from 2025 to 2030.
Play 10,000+ Casino Games at BC Game with Ease
- Instant Deposits And Withdrawals
- Crypto Casino And Sports Betting
- Exclusive Bonuses And Rewards

Frequently Asked Questions (FAQs)
1. Can Ethereum price surge past $3,000 despite recent dip?
2. Is Ethereum outperforming Bitcoin?
3. How high can Ethereum price rally in the near term?

Why Trust CoinGape
CoinGape has covered the cryptocurrency industry since 2017, aiming to provide informative insights Read more…to our readers. Our journal analysts bring years of experience in market analysis and blockchain technology to ensure factual accuracy and balanced reporting. By following our Editorial Policy, our writers verify every source, fact-check each story, rely on reputable sources, and attribute quotes and media correctly. We also follow a rigorous Review Methodology when evaluating exchanges and tools. From emerging blockchain projects and coin launches to industry events and technical developments, we cover all facets of the digital asset space with unwavering commitment to timely, relevant information.
24 Hours volume
$16.28B
Market Cap
$237.02B
Max Supply
NA

Related Articles


- Crypto Market Soars on Rumors of Trump’s 0% Tax Policy for Digital Assets
- Hong Kong Set to Launch Tokenized Bond Platform and Issue First Stablecoin Licenses
- US Senator Launches Probe Into Binance After Fortune Report on Sanctions Violations
- CLARITY Act Odds, Bitcoin Drop as Trump Skips Crypto in State of the Union Speech
- Tokenized Stock Market Gains Boost as Kraken and Binance Launches New Products
- Cardano Price Signals Rebound as Whales Accumulate 819M ADA
- Sui Price Eyes Recovery as Third Spot SUI ETF Debuts on Nasdaq
- Pi Network Price Eyes a 30% Jump as Migrations Jumps to 16M
- Will Ethereum Price Dip to $1,500 as Vitalik Buterin Continues Selling ETH?
- XRP Price Outlook as Clarity Act Passage Odds Plunge to 53%
- COIN Stock Risks Crashing to $100 as Odds of US Striking Iran Jump


