 Buy $GGs
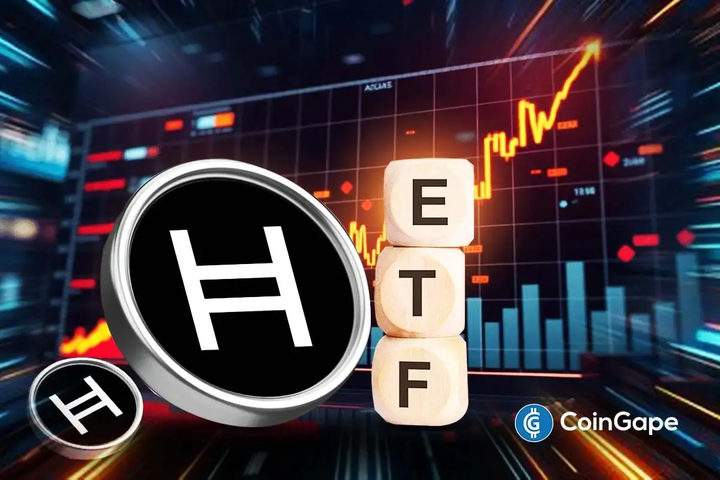
HBAR Price Contemplates $0.57 Retest as Hedera’s Stablecoin Hits Record Highs


Highlights
- HBAR price contemplates retesting te $0.57 level as the DMI indicator shows that the broader momentum remains bullish.
- A surge in buy-side pressure will aid HBAR's breakout from its tight consolidation range and support a breakout past the key resistance level of $0.26.
- Hedera's stablecoin market cap has surged to an all-time high abive $214M, highlighting a notable spike in network activity.
Hedera (HBAR) is contemplating retesting the $0.57 resistance level. This will likely happen soon due to surging network activity as Hedera’s stablecoin market cap hits an all-time high. With technical and on-chain data leaning bullish, will the altcoin rebound, or will HBAR price continue to drop?
HBAR Price Contemplates Retesting $0.57 Resistance
HBAR value today is showing signs of a bullish breakout. At press time, HBAR trades at a daily high of $0.19 with a 4.4% intraday gain from the daily low of $0.182. The rally coincides with an over 60% surge in Hedera’s stablecoin market cap to an all-time high of $91 million, according to data from DeFiLlama.
After its recent intraday gain, HBAR price is now attempting to flip resistance at the 23.6% Fibonacci level of $0.19 into support. If bulls defend this support, and the rally continues above the key resistance of $0.26, HBAR will make a 2x rally to $0.57.
The DMI index also leans towards a bullish Hedera price prediction as the +DI line (blue) continues oscillating above the -ve DI line (orange). This shows that despite HBAR’s price rally faltering after hitting a multi-year high of $0.39, buyers are still in control of the trend. As long as the DMI maintains this momentum, the price has room to make gains.
The RSI also fluctuates at a neutral level of 50, and this indicates that the market is at an equilibrium with neither bears nor bulls having dominance over price. Unless the RSI tips north and makes higher highs to confirm a bullish momentum, HBAR price may remain stuck within a tight range until buyers or sellers step in.

While the DMI is leaning bullish as HBAR attempts to turn the $0.19 resistance level into support, the ADX line is tipping south. This is indicative of a weak trend that may negate the above bullish thesis.
$1.68M Long Positions Risk Liquidation
One of the catalysts that may support a HBAR price rally to see it retest $0.57 is the looming risk of long liquidations. Data from Coinglass shows that at the $0.192 price, $1.68 million long traders risk having their positions closed through forced buying.

If these positions are closed, the resulting buy-side pressure will help drive a rise in the RSI. This may aid the breakout from the key resistance level at $0.26 and pave the way for a bullish leg to $0.57.
Considering the bullish setup on the daily chart and the risk of $1.68 million long liquidations as HBAR tests resistance at $1.92, it is likely that an upward rally will occur. However, these gains will depend on the market sentiment remaining bullish.
Play 10,000+ Casino Games at BC Game with Ease
- Instant Deposits And Withdrawals
- Crypto Casino And Sports Betting
- Exclusive Bonuses And Rewards

Frequently Asked Questions (FAQs)
1. Will HBAR price retest $0.57?
2. What do technical indicators show about Hedera’s price?
3. What catalyst will drive the next HBAR price rally?

Why Trust CoinGape
CoinGape has covered the cryptocurrency industry since 2017, aiming to provide informative insights Read more…to our readers. Our journal analysts bring years of experience in market analysis and blockchain technology to ensure factual accuracy and balanced reporting. By following our Editorial Policy, our writers verify every source, fact-check each story, rely on reputable sources, and attribute quotes and media correctly. We also follow a rigorous Review Methodology when evaluating exchanges and tools. From emerging blockchain projects and coin launches to industry events and technical developments, we cover all facets of the digital asset space with unwavering commitment to timely, relevant information.
24 Hours volume
$116.14M
Market Cap
$4.21B
Max Supply
1000M

Related Articles
- U.S.–Iran War: Monday Crypto Crash Odds Rise As Pundits Predict Oil Price Spike
- US-Iran War: Reports Confirm Bombings In UAE, Bahrain and Kuwait As Crypto Market Makes Recovery
- XRP Price Dips on US-Iran Conflict, But Capitulation Signals March Rebound
- Crypto Market at Risk as U.S.–Iran War Threatens Inflation With Oil Price Surge
- Polymarket U.S.–Iran Strike Bets Fuel Insider Trading Speculation as Crypto Traders Net $1.2M
- Circle (CRCL) Stock Price Prediction as Today is the CLARITY Act Deadline
- Analysts Predict Where XRP Price Could Close This Week – March 2026
- Top Analyst Predicts Pi Network Price Bottom, Flags Key Catalysts
- Will Ethereum Price Hold $1,900 Level After Five Weeks of $563M ETF Selling?
- Top 2 Price Predictions Ethereum and Solana Ahead of March 1 Clarity Act Stablecoin Deadline
- Pi Network Price Prediction Ahead of Protocol Upgrades Deadline on March 1


