 Buy $GGs
HBAR Price Prediction: Analyst Eyes 90% Surge Amid Taker Buy Dominance


Highlights
- An analyst projects a 90% rally if HBAR breaks above the descending channel.
- Cup and handle formation supports a bullish continuation toward the HBAR price forecast.
- Taker-buy dominance and rising Open Interest confirm strong buyer conviction across exchanges.
The HBAR price has recorded a sharp 11.13% rise in the last 24 hours, with trading volume spiking 140.74% to $480.8 million. This surge highlights strong renewed demand as investors react to improving technical signals and broader market confidence.
The Hedera price recovery has drawn analyst attention, with projections pointing toward a 90% rally from the ongoing channel structure. The recent approval of the Canary HBAR ETF, jointly launched by Bitwise and Canary, has further boosted sentiment around Hedera’s ecosystem.
HBAR Price Action Signals Breakout Toward $0.400
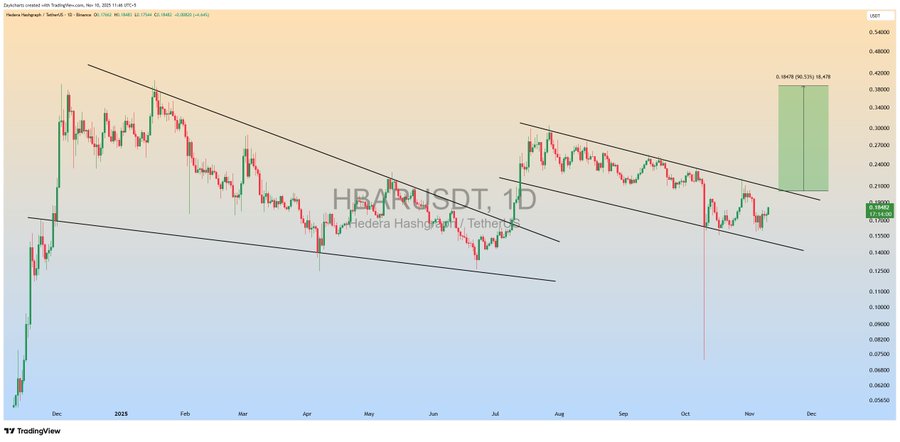
The HBAR price continues to move within a descending channel pattern that has guided its structure since mid-August, showing alternating periods of compression and rebound. The current HBAR value sits at $0.1920, rebounding from the lower boundary that previously acted as a strong demand zone.
According to crypto analyst ZAYK Charts, this formation mirrors a prior setup from early June, when a breakout above the upper trendline led to an explosive rally. The same structural rhythm is now developing, where sustained buying pressure and tighter ranges are often precursors to a reversal.
If price closes above the $0.20 region, it could validate the analyst’s 90% breakout projection toward $0.400. This renewed uptrend formation, supported by repeated higher lows, confirms that the Hedera price is once again building strength inside a high-probability reversal pattern.
Cup and Handle Pattern Reinforces Long-Term HBAR Price Forecast
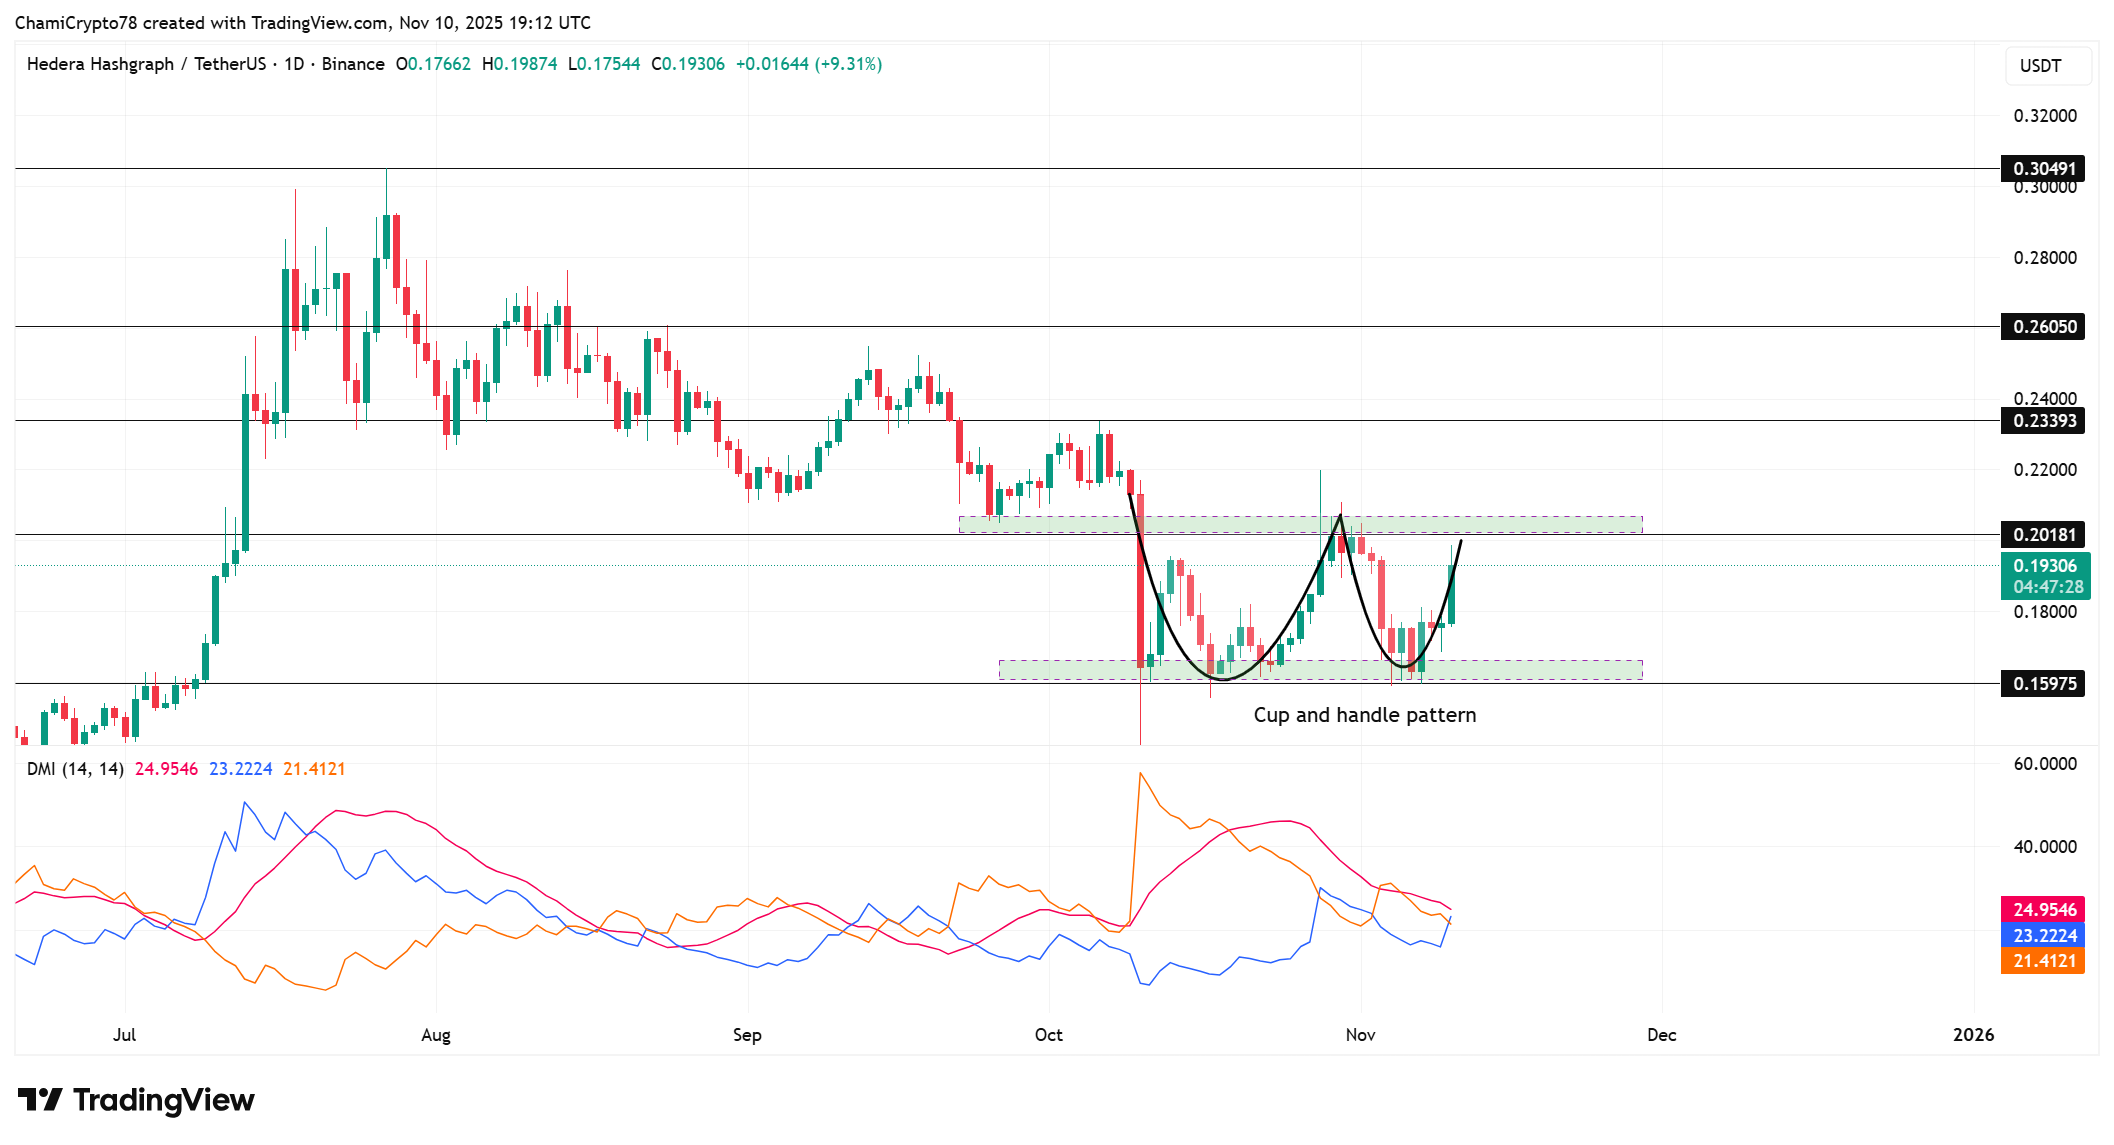
The HBAR price shows a defined cup and handle pattern on the 1-day chart, signaling a bullish continuation setup consistent with longer-term reversal phases. Price has rebounded strongly from the $0.159 demand zone, forming a rounded base that suggests sustained accumulation.
A confirmed breakout above the $0.201 neckline could push targets toward $0.233, $0.260, and ultimately $0.400, aligning with the analyst’s 90% projection.
Meanwhile, the DMI indicator shows +DI (23.22) crossing above –DI (21.41), supported by an ADX reading of 24.95, revealing growing trend strength. These signals affirm that the market is gaining directional conviction as the structure matures. Therefore, the long-term HBAR price projection points to a constructive setup for extended upside potential as the bullish pattern completes.
Taker Buys Lead the Charge as Open Interest Rises
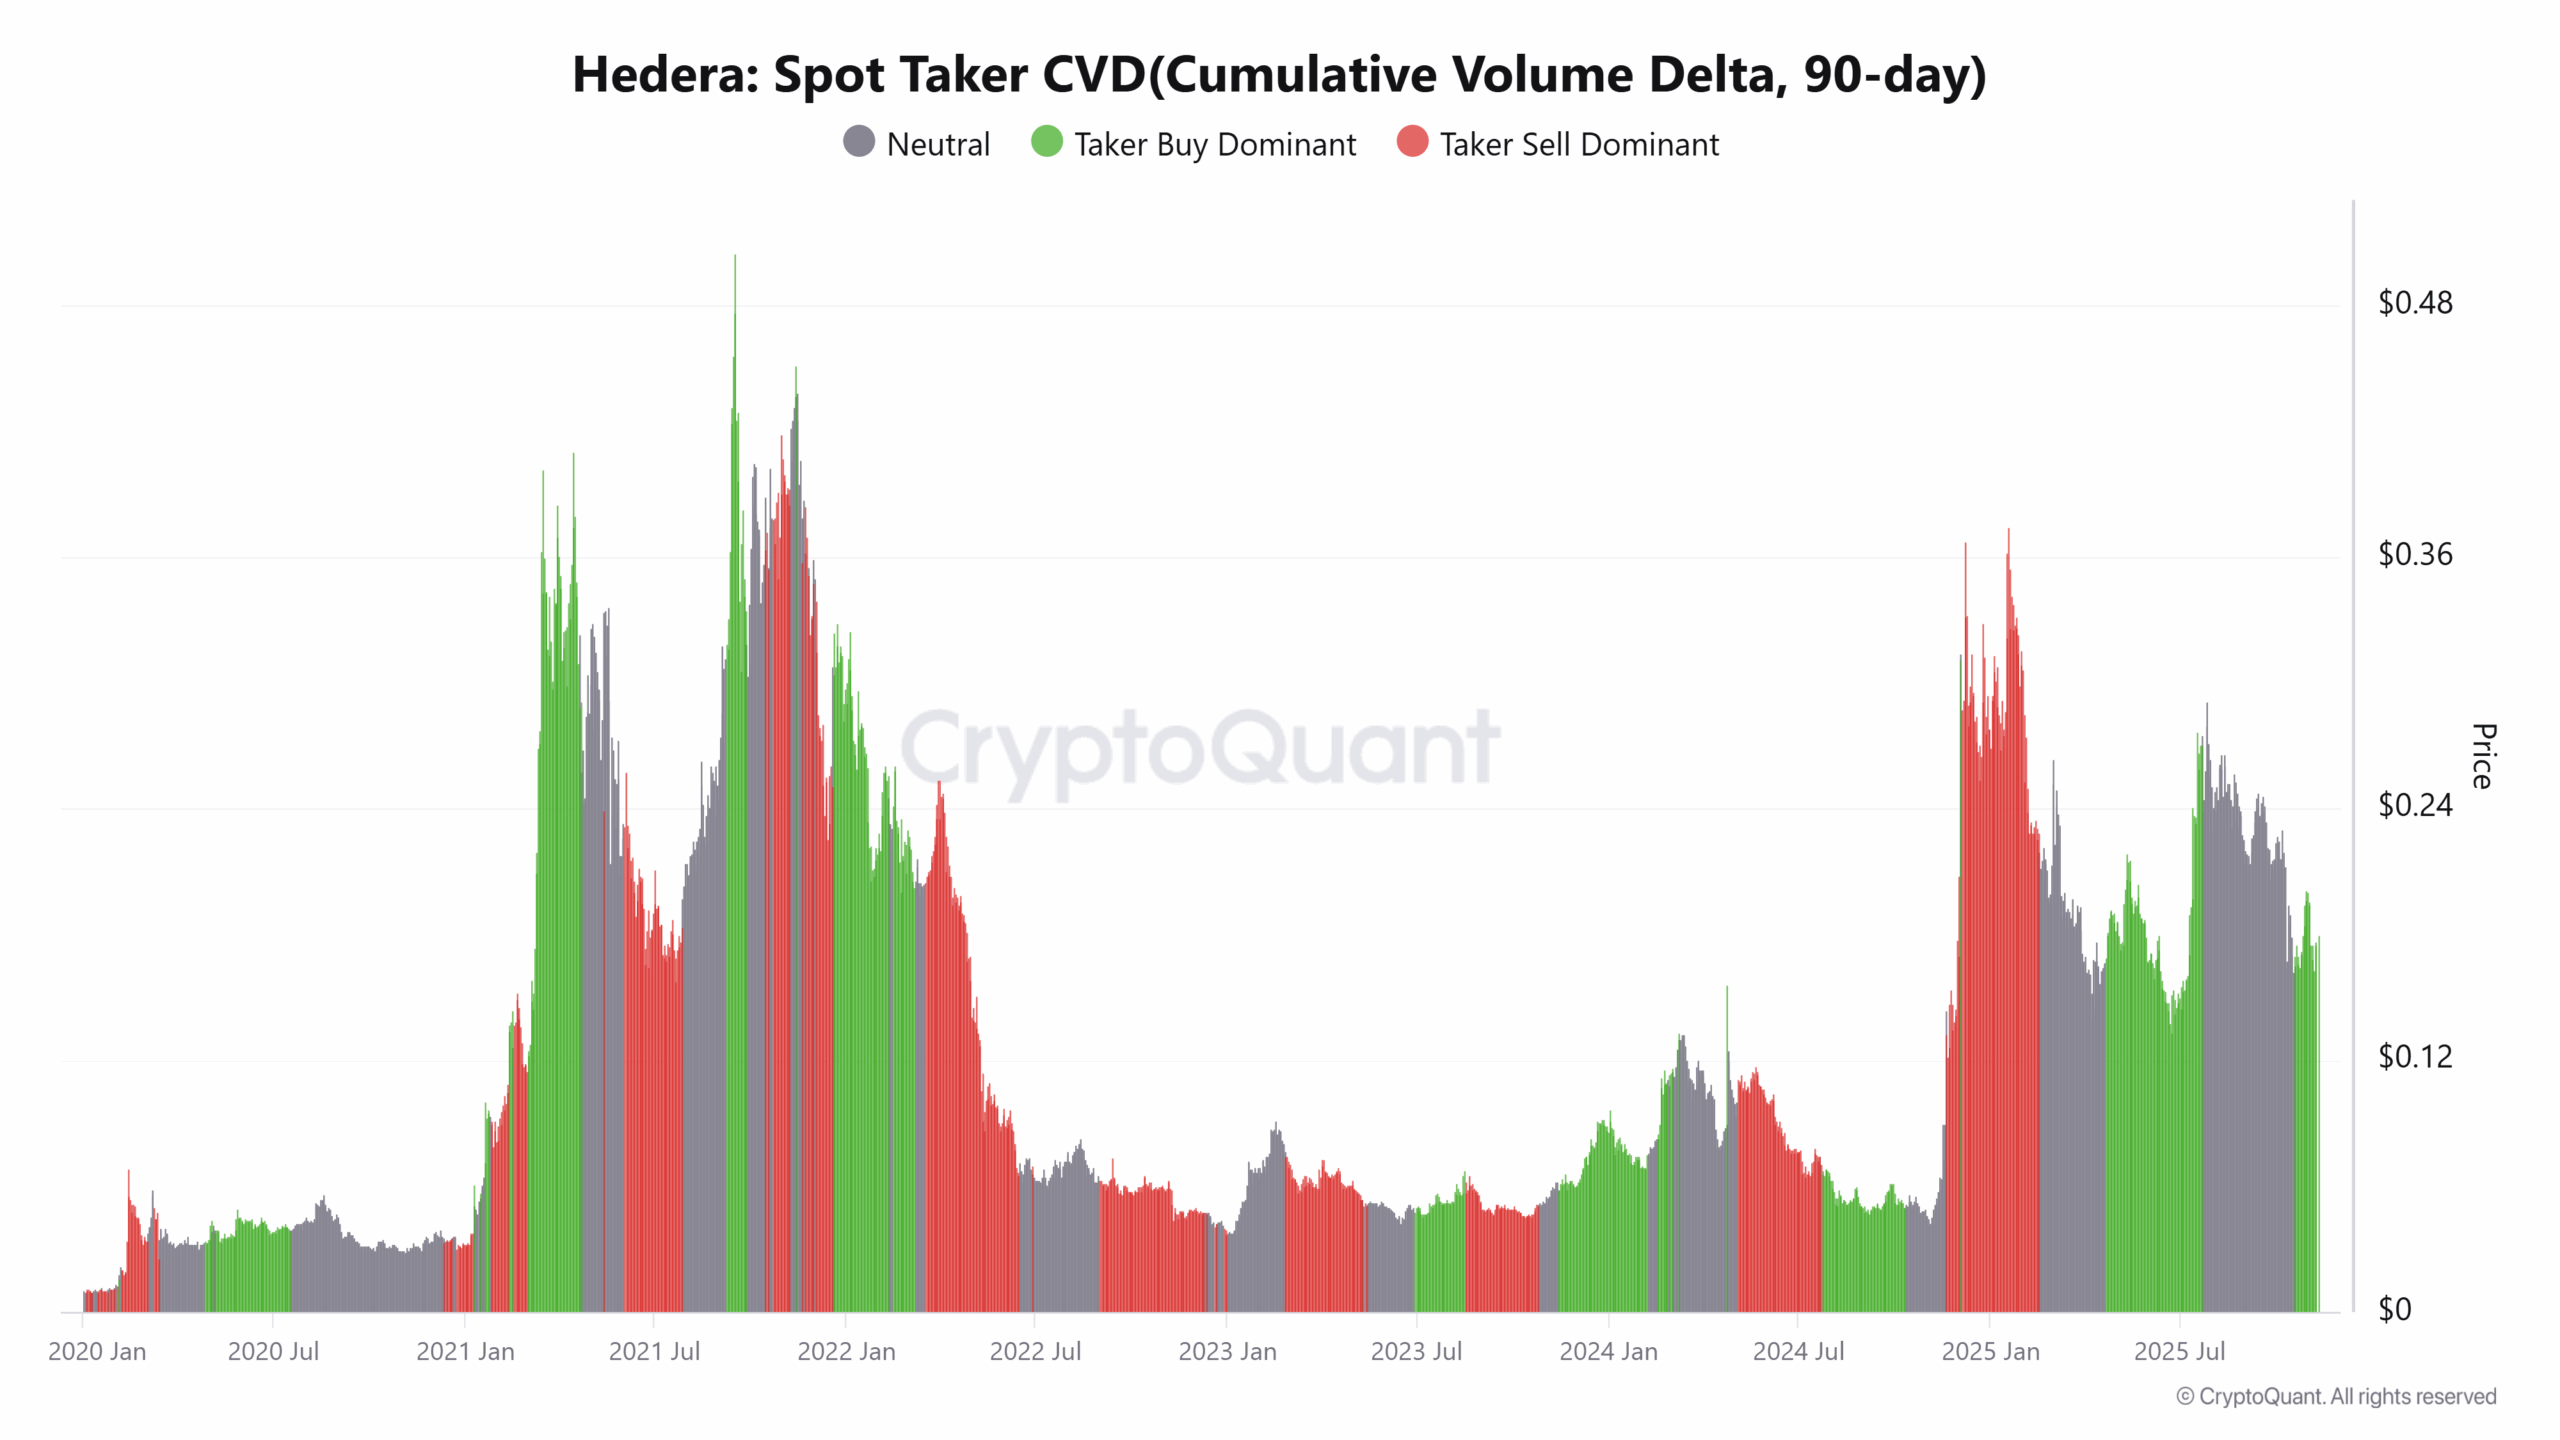
The 90-day Spot Taker CVD reveals that taker buys are clearly dominant, showing that aggressive market orders are favoring the buy side. This reflects strong confidence among participants positioning for upside continuation in the HBAR price.
Meanwhile, the launch of the Canary HBAR ETF under Nasdaq, alongside Bitwise’s Solana and Litecoin ETFs, has further fueled market enthusiasm. The ETF introduction signals growing institutional access to Hedera exposure and reinforces broader legitimacy for HBAR as an investment asset. Moreover, Bloomberg analyst Eric Balchunas’ confirmation of these ETF listings has drawn heightened investor interest, especially as Hedera gains more visibility among mainstream funds.
According to Coinglass, Open Interest has jumped 11.12% to $146.30 million, indicating a surge in leveraged positions favoring the long side. This rise aligns with increased speculative participation, showing traders are aligning with the bullish technical structure.
Combined, the dominance of taker buys and the new ETF approval create a strong demand foundation for Hedera. These developments collectively strengthen the Hedera price outlook, validating the analyst’s 90% rally projection toward $0.400.
To sum up, the HBAR price remains technically poised for a breakout as market participation and buying pressure intensify. The ascending momentum structure supports the case for a move above the $0.20 barrier. A confirmed breakout could fuel a rally toward the analyst’s $0.400 projection. Overall, the Hedera price continues to build strength, validating expectations of a 90% breakout rally.
Play 10,000+ Casino Games at BC Game with Ease
- Instant Deposits And Withdrawals
- Crypto Casino And Sports Betting
- Exclusive Bonuses And Rewards

Frequently Asked Questions (FAQs)
1. What is contributing to HBAR’s current market strength?
2. How does the DMI indicator support HBAR’s bullish setup?
3. Why is the cup and handle pattern significant for Hedera?

Why Trust CoinGape
CoinGape has covered the cryptocurrency industry since 2017, aiming to provide informative insights Read more…to our readers. Our journal analysts bring years of experience in market analysis and blockchain technology to ensure factual accuracy and balanced reporting. By following our Editorial Policy, our writers verify every source, fact-check each story, rely on reputable sources, and attribute quotes and media correctly. We also follow a rigorous Review Methodology when evaluating exchanges and tools. From emerging blockchain projects and coin launches to industry events and technical developments, we cover all facets of the digital asset space with unwavering commitment to timely, relevant information.

Related Articles


- Crypto Market Update: Top 3 Reasons Why BTC, ETH, XRP and ADA is Up
- Crypto News: Bitcoin Sell-Off Fears Rise as War Threatens Iran’s BTC Mining Operations
- U.S.–Iran War: Monday Crypto Crash Odds Rise As Pundits Predict Oil Price Spike
- US-Iran War: Reports Confirm Bombings In UAE, Bahrain and Kuwait As Crypto Market Makes Recovery
- XRP Price Dips on US-Iran Conflict, But Capitulation Signals March Rebound
- Bitcoin And XRP Price As US Kills Iran Supreme Leader- Is A Crypto Crash Ahead?
- Gold Price Prediction 2026: Analysts Expect Gold to Reach $6,300 This Year
- Circle (CRCL) Stock Price Prediction as Today is the CLARITY Act Deadline
- Analysts Predict Where XRP Price Could Close This Week – March 2026
- Top Analyst Predicts Pi Network Price Bottom, Flags Key Catalysts
- Will Ethereum Price Hold $1,900 Level After Five Weeks of $563M ETF Selling?


