 Buy $GGs
Here’s How Descending Triangle Pattern Limits The Solana Coin Recovery


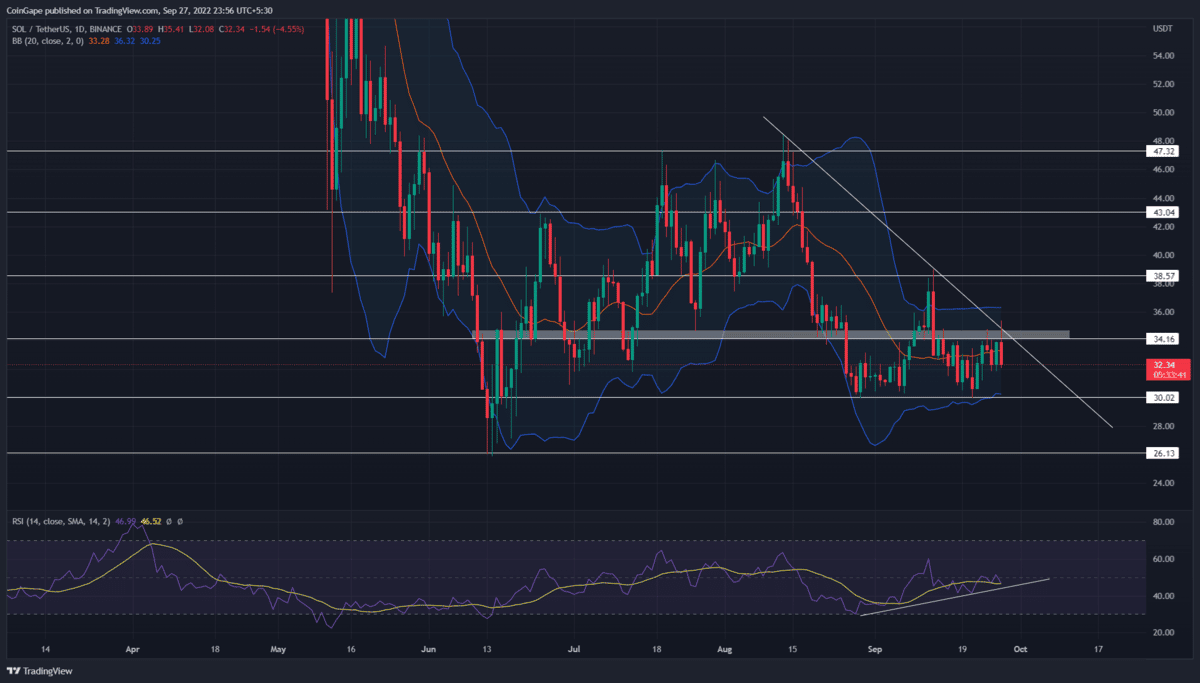
The daily technical chart shows the Solana coin price is in a short-term range-bound rally. Furthermore, this sideways is restricted within the top resistance of $47.4 and bottom support of $26. The coin holders should keep a keen eye on these levels as they will have a significant impact in the near term future.
Key points Solana coin analysis:
- The high wick rejection candles at $34.1 validate it as a strong supply zone
- The Solana price will continue its downward spiral until the resistance trendline is intact
- The 24-hour trading volume in the Solana coin is $1.2 Billion, indicating a 42% gain
 Source-Tradingview
The ongoing bear cycle within the aforementioned range has revealed a descending triangle pattern formation. In theory, this bearish continuation pattern triggers a significant boost in selling pressure once the coin price breaks below its neckline support.
Concerning this pattern, the Solana coin chart shows the $30 as the neckline support and a descending trendline as a dynamic resistance. Earlier today, the altcoin showcased a 4% gain and tried to break the $34.5 resistance.
However, the descending trendline intersected at the same level, creating a strong resistance zone for buyers. Moreover, the crypto market faces sudden selling pressure and evaporates the entire intraday gains.
The Solana coin price is currently trading at the $32.84 mark, with a 3.04% loss from yesterday’s closing.
Thus, a strong rejection candle formed at $34.5 resistance indicates the coin price is likely to tumble 9% lower to hit the $30 support. Under the influence of this pattern, the SOL price should eventually break the neckline support and carry the downfall another 12.5% down to reach the June low support of $26.
On a contrary note, a possible breakout from the resistance trendline will indicate a switch in market sentiment and an opportunity for price recovery.
Technical indicator
RSI: the daily-RSI slope shows an evident bullish divergence concerning the price restest to the $30 support. This divergence strengthens the possibility of a bullish recovery.
Bollinger band indicator: the coin price nosedive below the indicator midline indicates the sellers will remain in charge of price behavior.
- Resistance level- $34.5 and $38.5
- Support levels- $30 and $26
Play 10,000+ Casino Games at BC Game with Ease
- Instant Deposits And Withdrawals
- Crypto Casino And Sports Betting
- Exclusive Bonuses And Rewards


Why Trust CoinGape
CoinGape has covered the cryptocurrency industry since 2017, aiming to provide informative insights Read more…to our readers. Our journal analysts bring years of experience in market analysis and blockchain technology to ensure factual accuracy and balanced reporting. By following our Editorial Policy, our writers verify every source, fact-check each story, rely on reputable sources, and attribute quotes and media correctly. We also follow a rigorous Review Methodology when evaluating exchanges and tools. From emerging blockchain projects and coin launches to industry events and technical developments, we cover all facets of the digital asset space with unwavering commitment to timely, relevant information.

Related Articles


- U.S.-Iran War: U.S. Oil Prices Spike To One-Year High, Bitcoin and Gold Dip
- Crypto Traders Bet Against U.S.-Iran Ceasefire This Month as Iran Denies Peace Talks
- Ripple Prime Adds Support For Bitcoin, Ethereum, XRP, Solana Derivatives on Coinbase
- Bitcoin Price Still Risks Decline If Iran War Mirrors Ukraine War Market Reaction, JPMorgan Warns
- Bitget Unveils Upgrade For Stock, Gold Trading Alongside Crypto As Part Of Universal Exchange Push
- HOOD Stock Targets $100 as Robinhood Unveils Platinum Card and Advance Dividend Feature
- Bitcoin Price Prediction if Donald Trump Signs the CLARITY Act on April 3, 2026
- Pi Network Price As BTC Rallies Above $74K: Can PI Coin Extend Gains to $0.30?
- XRP Price As Bitcoin Reclaims $74K- Is $5 Next?
- Dogecoin Price Outlook as BTC Recovers Above $73,000
- XRP Price Prediction as Iran-U.S. Peace Talks Trigger a Crypto Rally


