 Claim Card
Here’s Why Binance Coin (BNB) Price Is at Risk of Further Downfall; Is $200 Next?


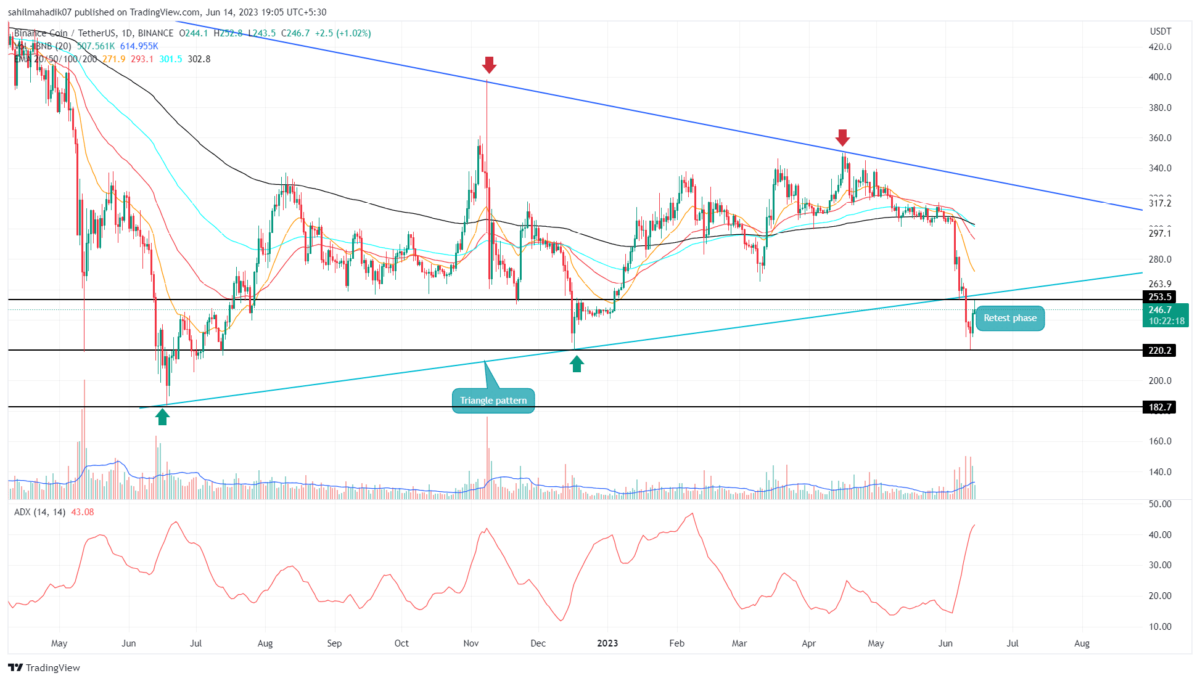
The first two weeks of June have been miserable for BNB holders as its price witnessed a significant freefall following its legal battle against the U.S. and the recent altcoin crash. From the June 1st high of $307.7, the Binance coin price lost nearly 28.5%, reaching a low of $220. However, amid this downfall, sellers gave a decisive breakdown from the symmetrical triangle pattern, suggesting that this altcoin may prolong its downward trend.
Also Read: Binance CEO CZ Responds to Allegations of Dumping BTC/BNB
Binance Price Daily Chart:
- The breakdown of the triangle pattern intensifies the supply pressure in BNB prices.
- A long-wick rejection at $253 indicates that traders are experiencing high supply.
- The intraday trading volume in the BNB coin is $745.5 million, indicating an 8% loss.
 (Source: Tradingview)
On June 10th, the falling BNB price breached the long-standing support trendline of a symmetrical triangle pattern. This pattern carried a sideways trend for nearly a year, and a breakdown below its key support intensified the underlying selling momentum.
However, in the last two days, the coin price witnessed a minor upswing to retest the pierced support as potential resistance. At the time of writing, the Binance coin price traded at $248 and showed a rejection candle, suggesting that sellers are defending the new resistance.
If the supply pressure persists, sellers may resume the prevailing correction and plunge the prices 26.5% down to reach $182.5.
Will the Binance Coin Price Plunge to $200?
Completing the symmetrical triangle pattern on a bearish note, the BNB price is poised for a massive downfall. The coin’s price is currently in a retest phase, where it validates that its price is experiencing sufficient supply pressure from the breached trendline. If sellers sustainably stay below the trendline, the coin price could drop to $220, followed by $200.
- Average Directional Index: The ADX slope wavering at 41% reflects instability in the current downtrend, and thus, a minor pullback was necessary to replenish bullish momentum.
- Exponential Moving Average: A bearish crossover between the 100-day and 200-day EMAs may attract more sellers to the market.

Why Trust CoinGape
CoinGape has covered the cryptocurrency industry since 2017, aiming to provide informative insights Read more…to our readers. Our journal analysts bring years of experience in market analysis and blockchain technology to ensure factual accuracy and balanced reporting. By following our Editorial Policy, our writers verify every source, fact-check each story, rely on reputable sources, and attribute quotes and media correctly. We also follow a rigorous Review Methodology when evaluating exchanges and tools. From emerging blockchain projects and coin launches to industry events and technical developments, we cover all facets of the digital asset space with unwavering commitment to timely, relevant information.

Related Articles


- Expert Predicts Deeper Bitcoin Decline as JPMorgan CEO Warns of Similarities to the 2008 Financial Crisis
- Trump Won’t Pardon FTX’s Sam Bankman-Fried (SBF), White House Says
- Third Spot SUI ETF Goes Live as 21Shares Fund Launches on Nasdaq
- Mark Zuckerberg’s Meta Reportedly Eyes Stablecoin Integration This Year Amid Regulatory Clarity
- Coinbase Rivals Robinhood As It Rolls Out Stocks, ETFs Trading In ‘Everything Exchange’ Push
- Cardano Price Signals Rebound as Whales Accumulate 819M ADA
- Sui Price Eyes Recovery as Third Spot SUI ETF Debuts on Nasdaq
- Pi Network Price Eyes a 30% Jump as Migrations Jumps to 16M
- Will Ethereum Price Dip to $1,500 as Vitalik Buterin Continues Selling ETH?
- XRP Price Outlook as Clarity Act Passage Odds Plunge to 53%
- COIN Stock Risks Crashing to $100 as Odds of US Striking Iran Jump


