Here’s Why Ethereum Could Rally 10% Before Continuing Its Downfall


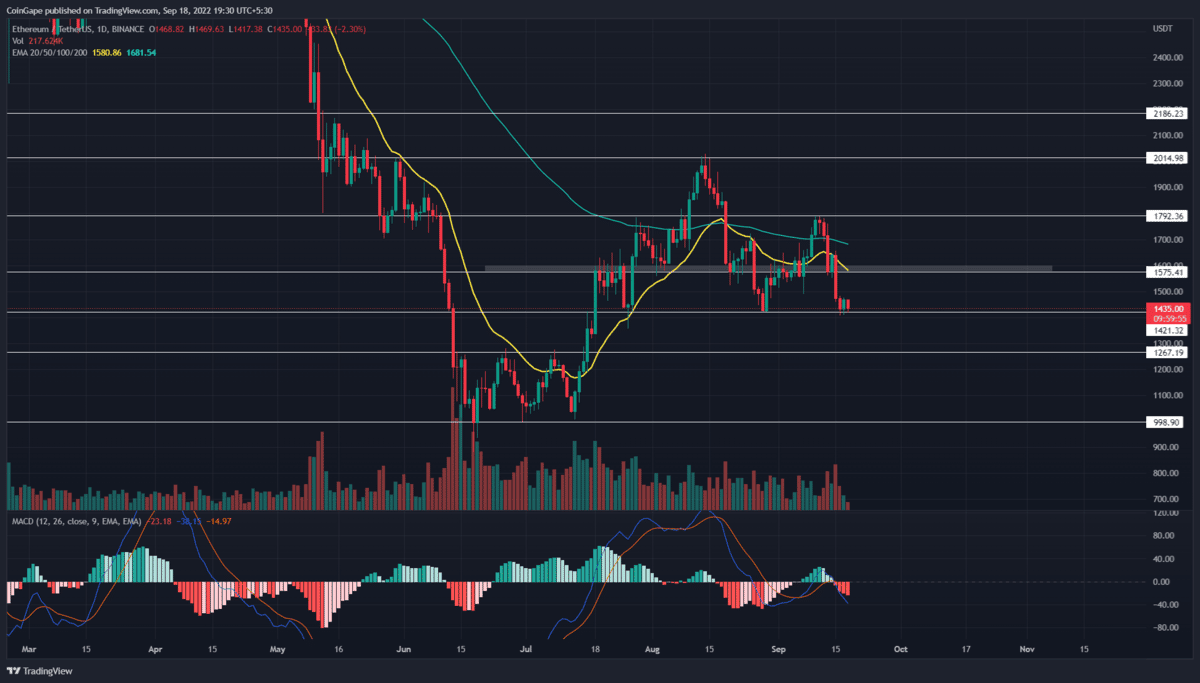
The recent widespread correction in the crypto market reverted the Ethereum price from $1800 resistance. This sell-off entirely evaporated the early September recovery and plunged the prices back to the monthly support zone of $1420. However, the price action shows reversal signs at this support, indicating a possible relief rally.
Key points:
- The coin chart shows the formation of a double bottom pattern in the 4-hour time frame chart.
- Losing the $1420 could plummet the Ethereum price bac
- The intraday trading volume in Ethereum is $10.65 Billion, indicating a loss of 12.2%.
 Source- Tradingview
Furthermore, it’s been three days since the sellers are wrestling buyers at this support to prolong this correction. Furthermore, with a 2.575% loss, the Ethereum price is painted red today and retests the $1420 support.
If the sellers manage a daily candle closing below the aforementioned support, the accelerated selling pressure will plunge the altcoin to $1000 psychological support.
Ethereum Could Rally With This Double Bottom Pattern
 Source- Tradingview
The four-time chart shows a lower price rejection candle at the $1420 support indicating the traders are actively buying at this level. Moreover, the RSI indicator displaying bullish divergence to base support indicates a better possibility for price reversal.
If this theory worked out, the Ethereum price could rally 3.88% higher to challenge the $1470 neckline of double bottom pattern. A bullish breakout from this resistance will further encourage buying activity and retest the $1575 supply zone.
Anyhow, the price action at this level is crucial to influence future Ethereum prices.
Due to the accumulation of daily EMAs at this level, a possible reversal could display a lower high in the daily chart indicating a losing bearing momentum.
However, if the Ethereum price surpasses this level, it indicates the recent correction was just panic selling in the market.
Technical indicator-
Bollinger band: the falling Ethereum price retest the indicator’s band support. Such activity has previously resulted in a bullish reversal, bolstering the relief rally theory.
MACD indicator: A widespread between the bearishly aligned fast and slow line below the neutral zone indicates aggressive selling in the market.
- Resistance level- $1470 and $1520
- Support level- $1400 and $1362

Why Trust CoinGape
CoinGape has covered the cryptocurrency industry since 2017, aiming to provide informative insights Read more…to our readers. Our journal analysts bring years of experience in market analysis and blockchain technology to ensure factual accuracy and balanced reporting. By following our Editorial Policy, our writers verify every source, fact-check each story, rely on reputable sources, and attribute quotes and media correctly. We also follow a rigorous Review Methodology when evaluating exchanges and tools. From emerging blockchain projects and coin launches to industry events and technical developments, we cover all facets of the digital asset space with unwavering commitment to timely, relevant information.

Related Articles


- Tom Lee’s Bitmine Doubles Down on Ethereum With $34.7M Fresh Purchase
- BlackRock Buys $65M in Bitcoin as U.S. Crypto Bill Odds Passage Surge
- Bitcoin Sell-Off Ahead? Garett Jin Moves $760M BTC to Binance Amid Trump’s New Tariffs
- CLARITY Act: Trump’s Crypto Adviser Says Stablecoin Yield Deal Is “Close” as March 1 Deadline Looms
- Trump Tariffs: U.S. To Impose 10% Global Tariff Following Supreme Court Ruling
- Ethereum Price Rises After SCOTUS Ruling: Here’s Why a Drop to $1,500 is Possible
- Will Pi Network Price See a Surge After the Mainnet Launch Anniversary?
- Bitcoin and XRP Price Prediction As White House Sets March 1st Deadline to Advance Clarity Act
- Top 3 Price Predictions Feb 2026 for Solana, Bitcoin, Pi Network as Odds of Trump Attacking Iran Rise
- Cardano Price Prediction Feb 2026 as Coinbase Accepts ADA as Loan Collateral
- Ripple Prediction: Will Arizona XRP Reserve Boost Price?


