 Buy $GGs
Here’s Why Polygon Price Rally Is Set For Another 8% Jump


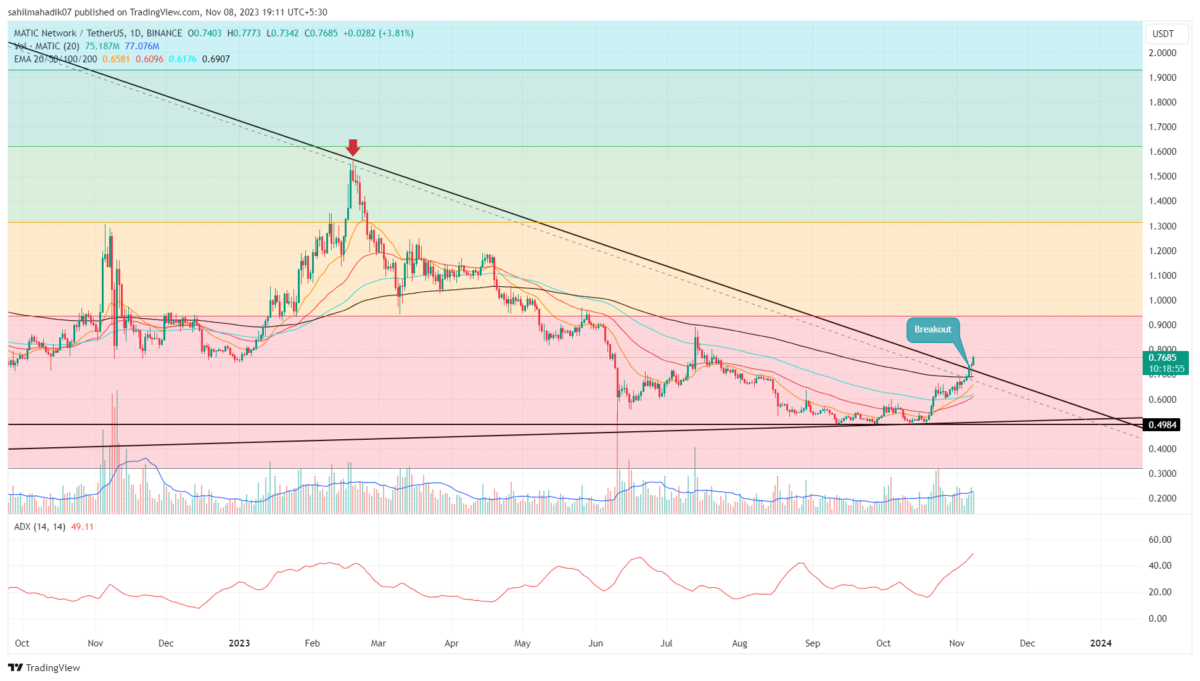
The polygon coin price is rising with a broadening channel pattern. In theory, even though this chart pattern leads a steady uptrend, the coin price is susceptible to a significant correction if it breaches the support trendline. However, the prices currently witness a bull cycle within this pattern and a possible breakout from $0.947 should push the altcoin higher.
Key points:
- A broadening channel pattern govern the Polygon coin price
- A bullish breakout from $0.9477 will accelerate the bullish momentum for 8% jump
- The intrARy trading volume in the AR coin is $268.3 Billion, indicating a 667.5% gain.
 Source- Tradingview
Meta, the Web2 giant, announced Polygon as its initial partner for upcoming non-fungible token tools, where you’ll be able to create and sell NFTs on social media platform Instagram. As a result, the MATIC witnessed a significant inflow and surged 10%. Currently the price trend sustains the uptrend starting from the last few weeks, accounting for a monthly growth of 26.5%.
Soon you’ll be able to make and sell #NFTs on @instagram, starting with @0xPolygon. You can also now connect to @solana and Phantom wallet, and see information about @opensea collection: https://t.co/aH8035Tk8n
Comment your #NFT below 👇 pic.twitter.com/dvHau9n9Yu
— Meta (@Meta) November 2, 2022
Moreover, the increasing demand overwhelms the bullish influence over the EMAs, as the 50 and 100-day EMA gain spread after the recent crossover.
Also read: “I Will Not Rest”- Polygon (MATIC) Founder On zkEVM Controversy
Analyzing the daily price trend, a rising expanding channel is prominent, starting from the bottom level of $0.70. Taking multiple bounces from the support trendline, the strength of underlying bullishness overwhelms the price trend.
However, despite the bullish trend in action with positive news for the company, the price trend struggles to ride above the $0.947 resistance. Nonetheless, optimistic buyers can find the $0.947 breakout as an entry point.
In case the uptrend continues, the Polygon coin price will increase to reach the overhead trendline close to $1.027 mark, registering a 8% jump..
Conversely, if the supply pressure persists at $0.947 or resistance trend, a retracement to the support trendline is possible.
Technical Indicator
Relative Strength index: A negative divergence in the daily-RSI slope indicates weak bullish momentum. This divergence bolsters a possible correction in MATIC price.
EMAs: The sudden price jump in MATIC price breached the 20-and-200-day EMA, providing extra edge for long position traders.
Polygon Price Intraday Levels
- Spot rate: $0.95
- Trend: Bullish
- Volatility: Low
- Resistance levels- $0.947 and $1.02
- Support levels- $0.868 and $0.77
Play 10,000+ Casino Games at BC Game with Ease
- Instant Deposits And Withdrawals
- Crypto Casino And Sports Betting
- Exclusive Bonuses And Rewards


Why Trust CoinGape
CoinGape has covered the cryptocurrency industry since 2017, aiming to provide informative insights Read more…to our readers. Our journal analysts bring years of experience in market analysis and blockchain technology to ensure factual accuracy and balanced reporting. By following our Editorial Policy, our writers verify every source, fact-check each story, rely on reputable sources, and attribute quotes and media correctly. We also follow a rigorous Review Methodology when evaluating exchanges and tools. From emerging blockchain projects and coin launches to industry events and technical developments, we cover all facets of the digital asset space with unwavering commitment to timely, relevant information.

Related Articles


- Core Scientific Sells 1,900 BTC as Bitcoin Miner Pivots to AI, CORZ Stock Dips
- Bitcoin News: VanEck CEO Projects Gradual BTC Rally in 2026 as ETFs Sees $458M Inflows
- Bitcoin, Gold Slip as Donald Trump Says “Unlimited Munition Stockpiles” for US-Iran War
- Crypto Prices Today: BTC, ETH, XRP Prices Surge Despite Iran’s Strait of Hormuz Closure
- Nasdaq Brings Prediction Markets to Wall Street with New SEC Filing
- Bitcoin Price Prediction as US-Iran War Enters 4th Consecutive Day
- Top 5 Historical Reasons Dogecoin Price Is Not Rising
- Pi Coin Price Prediction for March 2026 Amid Network Upgrade, KYC Boost, Rewards Distribution
- Gold Price Nears ATH; Silver Eyes $100 Breakout on Us- Iran War
- Bitcoin And XRP Price As US Kills Iran Supreme Leader- Is A Crypto Crash Ahead?
- Gold Price Prediction 2026: Analysts Expect Gold to Reach $6,300 This Year


