 Buy $GGs
Here’s Why Rising MANA Price May Witness 20% Upswing In Coming Weeks


Amid the recent consolidation phase in the crypto market, the falling MANA price found support at the $0.29-$0.2975 mark. While market participants remain uncertain, the price action walked sideways and created a narrow range between the mentioned support and $0.357 resistance. Thus, It has been three weeks since this meta coin has been trapped within the range and has limited the growth potential. However, the daily technical chart reveals this consolidation as the formation of a famous bullish reversal pattern candle double bottom.
Key points:
- Under the influence of a bullish pattern, the MANA price is set for a 20% upswing
- The possible rejection from the $0.356 resistance will undermine the bullish thesis.
- The 24-hour trading volume in the Decentraland token is $116,6 Million, indicating a 207.99% gain.
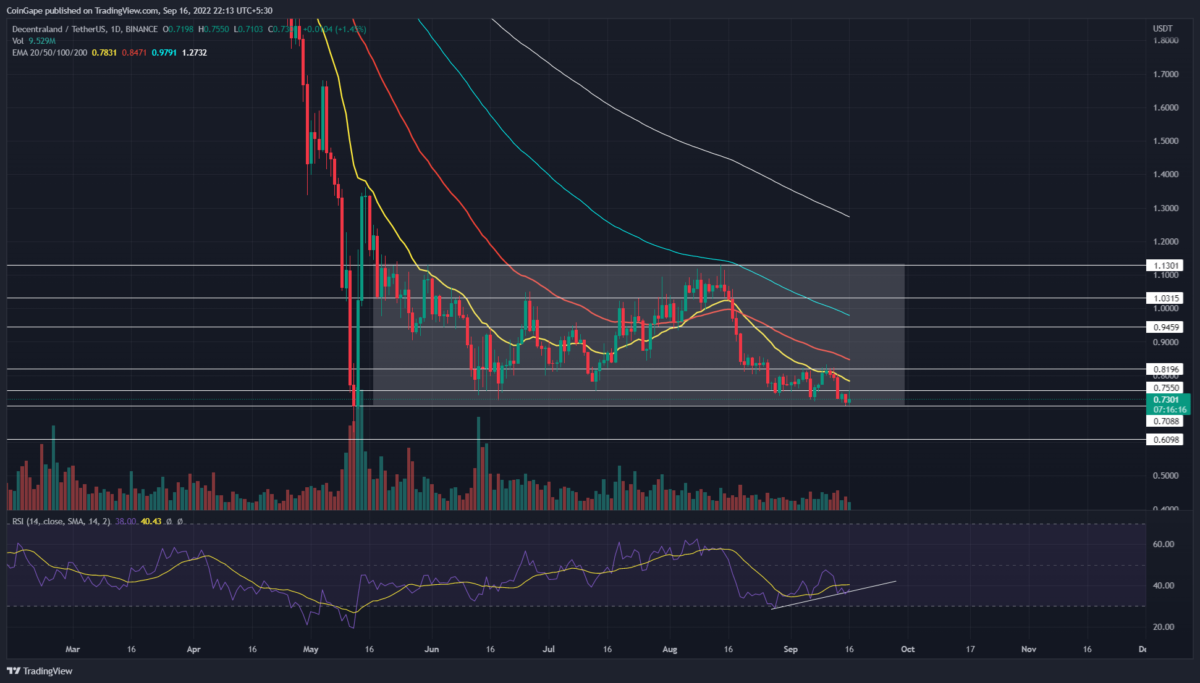
 Source-Tradingview
The double bottom pattern is easily identified as it is shaped into a ‘W’ letter design. During the pattern formation, the price rebounded twice more fixed horizontal support twice, indicating price sustainability above base support.
Thus, with the recent recovery in the crypto market, the MANA price rebounded from the $0.29-$0.2975 support on December 31st and surged 20% higher to hit $0.356 resistance. This barrier is also the neckline of this pattern, whose breakout will encourage further growth in MANA tokens.
Also Read: Explained: What is Physical NFT? and How to Sell Physical Items as NFT
By the press time, the MANA price trades at the $0.352 mark and shows a 7.5% intraday jump. This bullish candle tries to break the neckline resistance of $0.356 to trigger the bullish reversal pattern.
Thus, a daily candle closing above the mentioned will accelerate the buying pressure and offer long entry opportunities for traders. This breakout could soar the MANA price 20% higher to hit the local resistance of $0.425.
However, if the prices can’t sustain above the $0.356 mark, the price consolidation will extend for a few more trading sessions.
Technical indicator
Moving average convergence/divergence: The MACD line(blue) crossing above the signal line(orange) gives a buy signal for the market participant. Moreover, the increasing gap between these slopes indicates sustained buying in the market.
DMAs: the 50 DMA is moving near the $0.356 mark, making this resistance even tougher to break out.
MANA Coin Price Intraday Levels
- Spot rate: $0.35
- Trend: Bullish
- Volatility: Low
- Resistance level- $0.35 and $0.425
- Support level- $0.297 and $0.23
Play 10,000+ Casino Games at BC Game with Ease
- Instant Deposits And Withdrawals
- Crypto Casino And Sports Betting
- Exclusive Bonuses And Rewards


Why Trust CoinGape
CoinGape has covered the cryptocurrency industry since 2017, aiming to provide informative insights Read more…to our readers. Our journal analysts bring years of experience in market analysis and blockchain technology to ensure factual accuracy and balanced reporting. By following our Editorial Policy, our writers verify every source, fact-check each story, rely on reputable sources, and attribute quotes and media correctly. We also follow a rigorous Review Methodology when evaluating exchanges and tools. From emerging blockchain projects and coin launches to industry events and technical developments, we cover all facets of the digital asset space with unwavering commitment to timely, relevant information.

Related Articles

- Analyst Predicts XRP Price Could Fall to $1 as XRP ETFs Record Net Weekly Outflows
- U.S.-Iran War: Trump Threatens to Hit Iran ‘Very Hard’ Today as Bitcoin Faces New Selling Pressure
- Crypto Market Weekly Recap: US-Iran War Steer Crypto Prices, Kraken Gets Fed Master Account, Tokenization Push March 2-6
- Bitcoin Price Faces Further Crash as Whales Liquidates Recently Bought BTC: Report
- ‘Iran Will Not Surrender’: Crypto Market Falls Again as US–Iran Tensions Rise
- Dogecoin, Pepe coin, and Shiba Inu Price Prediction As BTC Crashes Below $70k
- Here’s Why Cardano Price Has Not Reclaimed $0.30
- Will XRP Price Crash as U.S. Nonfarm Payrolls Fell by 92,000 in February?
- Pi Network Price Eyes a 40% Surge as Pi Day Looms on March 14
- Top Reasons Why Circle Stock Price is Surging
- Gold Price Prediction as US-Iran War Hits the Second Week


