 Buy $GGs
HNT Holders Loses May Low Support; What Next?


The symmetrical triangle pattern breakout triggered a drastic fall, plummeting the HNT price May low of $6.76. In addition, as the Crypto markets continue to suffer under a bearish cloud the coin price bridged this bottom support indicating a new 2022 low will be formed for Helium
Key points from HNT analysis:
- The HNT chart shows a high Momentum breakdown from the %6.7.
- Low volume retest offers an entry opportunity for interested short-sellers
- The intraday trading volume in the Helium coin is $7.2 Million, indicating a 40 gain.
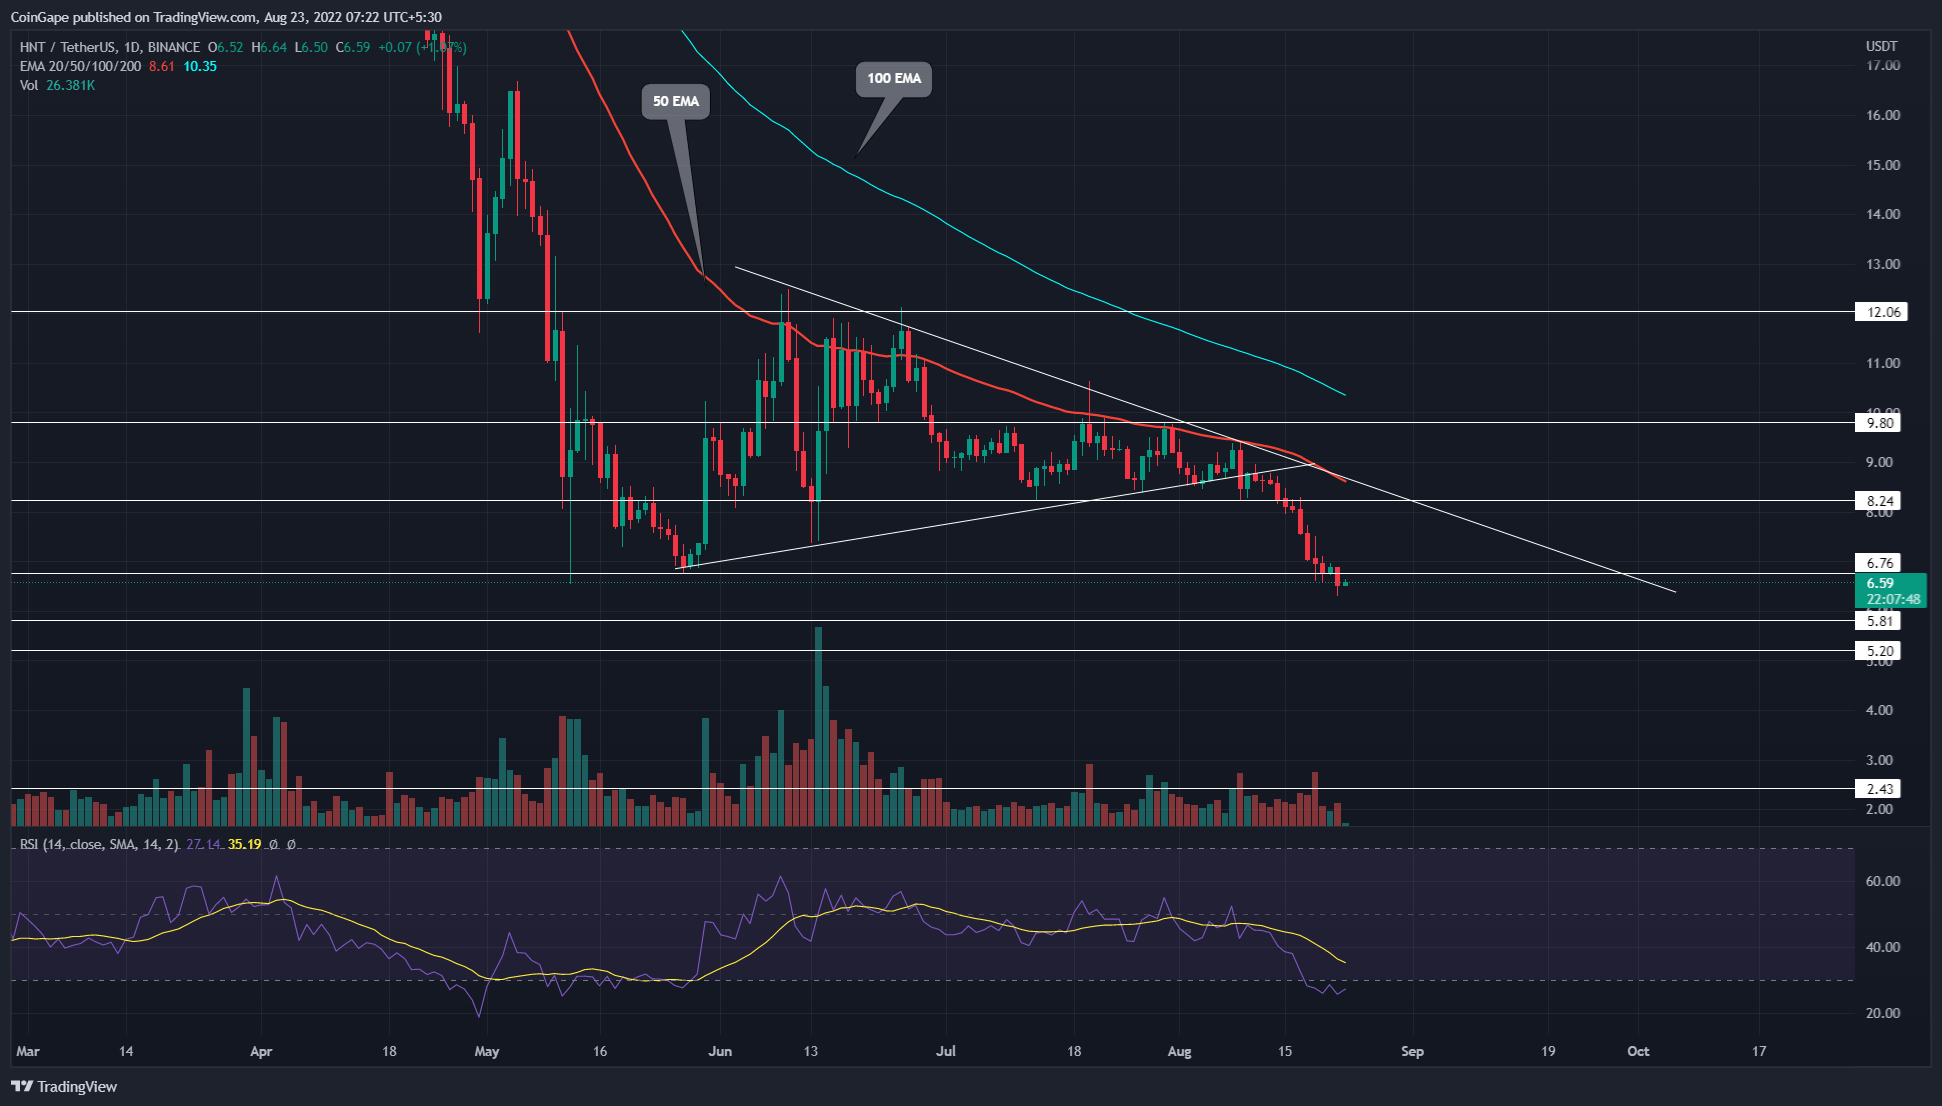 Source- tradingview
While several cryptocurrencies showed phenomenal growth in June and July, the HNT price kept wavering in a sideways rally. Furthermore, this price consolidation displayed the formation of a symmetrical triangle pattern in the daily time frame chart.
In theory, this continuation pattern triggers a direction rally when the price gives a suitable breakout from either trendline. Therefore, the recent upsurge in selling pressure triggered a bearish breakdown from this pattern.
The post-retest fall showcased ten consecutive red candles and plunged the HNT price by 24.7%. Thus, with sustained selling, altcoin slumped to the May low support of $6.75.
Starting the new week, the HNT price breached this bottom support indicating the continuation of the prevailing downtrend. Thus, the daily candlestick closing will allow sellers to test the $6.75 level as potential resistance.
If the coin price sustains below the $6.75 mark, the resulting downfall may plummet 22.5% lower to hit the next significant supply zone of $5.23.
Moreover, if the price shows some in-between bullish pullback, the trendline may assist sellers in maintaining this downward trend.
On a contrary note, closing above the resistance trendline will give an early sign of recovery.
Technical indicator
Relative Strength Index: The daily-RSI slope dived into the oversold region along with the support breakdown. The indicator value is so low, indicating a possibility of a bullish pullback.
EMAs: The downsloping 100-and-200-day EMA accentuates an overall bear trend. Moreover, the 50-day EMA acts as dynamic resistance for HNT price.
- Resistance levels- $6.76 and $83.24
- Support levels are $5.8 and $5.2
Play 10,000+ Casino Games at BC Game with Ease
- Instant Deposits And Withdrawals
- Crypto Casino And Sports Betting
- Exclusive Bonuses And Rewards


Why Trust CoinGape
CoinGape has covered the cryptocurrency industry since 2017, aiming to provide informative insights Read more…to our readers. Our journal analysts bring years of experience in market analysis and blockchain technology to ensure factual accuracy and balanced reporting. By following our Editorial Policy, our writers verify every source, fact-check each story, rely on reputable sources, and attribute quotes and media correctly. We also follow a rigorous Review Methodology when evaluating exchanges and tools. From emerging blockchain projects and coin launches to industry events and technical developments, we cover all facets of the digital asset space with unwavering commitment to timely, relevant information.

Related Articles


- Core Scientific Sells 1,900 BTC as Bitcoin Miner Pivots to AI, CORZ Stock Dips
- Bitcoin News: VanEck CEO Projects Gradual BTC Rally in 2026 as ETFs Sees $458M Inflows
- Bitcoin, Gold Slip as Donald Trump Says “Unlimited Munition Stockpiles” for US-Iran War
- Crypto Prices Today: BTC, ETH, XRP Prices Surge Despite Iran’s Strait of Hormuz Closure
- Nasdaq Brings Prediction Markets to Wall Street with New SEC Filing
- Bitcoin Price Prediction as US-Iran War Enters 4th Consecutive Day
- Top 5 Historical Reasons Dogecoin Price Is Not Rising
- Pi Coin Price Prediction for March 2026 Amid Network Upgrade, KYC Boost, Rewards Distribution
- Gold Price Nears ATH; Silver Eyes $100 Breakout on Us- Iran War
- Bitcoin And XRP Price As US Kills Iran Supreme Leader- Is A Crypto Crash Ahead?
- Gold Price Prediction 2026: Analysts Expect Gold to Reach $6,300 This Year


