 Buy Presale
How Far May XRP Price Extend Its Correction Phase?


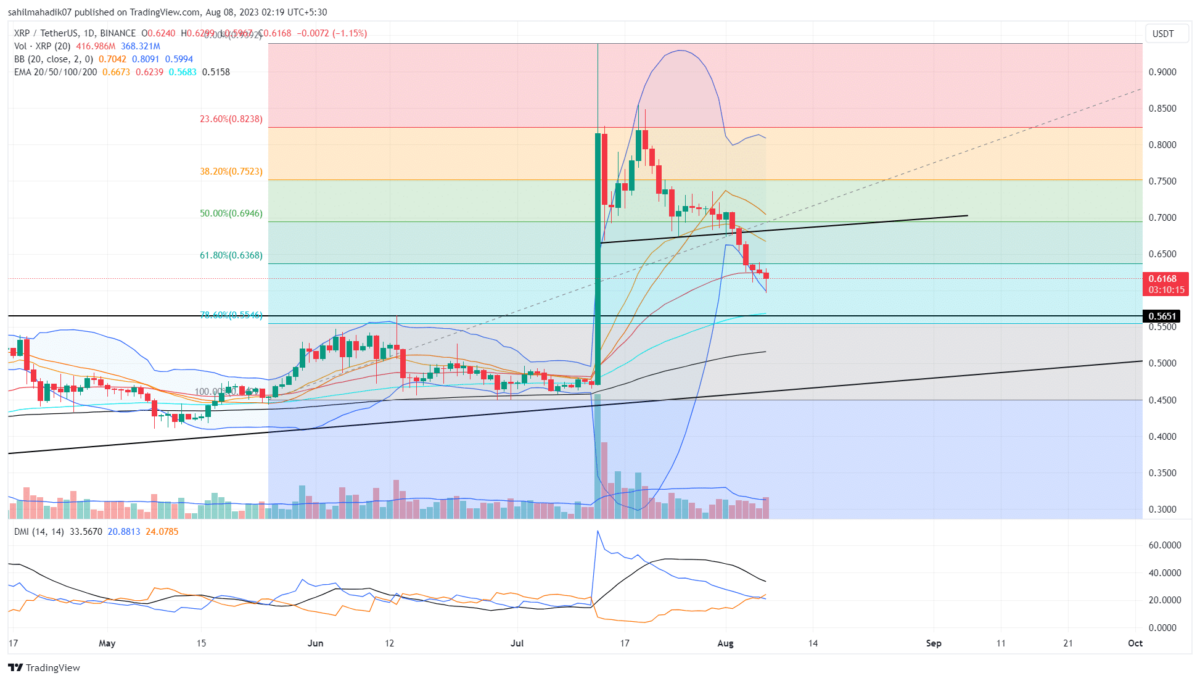
In the latter part of July, the XRP price found suitable support at an ascending trendline near $0.67. However, with increased bearishness in the crypto market, the sellers gained an advantage and breached the aforementioned support with high volume. This breakdown intensified the selling momentum leading to the bloodbath of six red candles. Will XRP sellers evaporate the July 13% gain?
Also Read: XRP Lawsuit Has Delayed Ripple’s Product Development: Flare Founder
XRP Price Daily Chart:
- The XRP price falling with increasing volume indicates sustained selling from market participants.
- The $0.56 level stands as a strong support zone for buyers.
- The intraday trading volume in the XRP is $1.4 Billion, indicating a 75.1% gain.
 Source: Tradingview
On August 3rd, the XRP price gave a high momentum breakdown from the support trendline, which held buyers during the second half of July. From the breakdown point($0.679), the altcoin tumbled nearly 10% to reach the current price of $0.614.
Amid this downfall, the sellers also breached the 61.8% Fibonacci retracement level. In technical analysis, a breakdown below the 50% level starts, indicating weakness in the prevailing trend. Therefore, traders must remain cautious of the current downfall as a drop of such length indicates weakness in bullish momentum.
With sustained selling, the XRP price could drop another 8% to reach the next significant support of $0.56 aligned with 78.6% FIB. Losing this support would offset the recovery witnessed on July 13th.
Will XRP Price Rise Back to $0.66?
The daily chart projecting a long-tail rejection indicates that buyers are entering the market at a discounted price. This buildup of bullish momentum may trigger a pullback in a downward trend. If the anticipated uptick showed sustainability below the breached trendline or $0.66, the sellers are likely to extend the correction trend.
- Bollinger Band: The downsloping lower band of the Bollinger band indicator indicates high momentum selling among traders.
- Directional Moving Index: A bearish crossover between the DI+(blue) and DI(orange) slope reflects the selling signal in the market.
Play 10,000+ Casino Games at BC Game with Ease
- Instant Deposits And Withdrawals
- Crypto Casino And Sports Betting
- Exclusive Bonuses And Rewards


Why Trust CoinGape
CoinGape has covered the cryptocurrency industry since 2017, aiming to provide informative insights Read more…to our readers. Our journal analysts bring years of experience in market analysis and blockchain technology to ensure factual accuracy and balanced reporting. By following our Editorial Policy, our writers verify every source, fact-check each story, rely on reputable sources, and attribute quotes and media correctly. We also follow a rigorous Review Methodology when evaluating exchanges and tools. From emerging blockchain projects and coin launches to industry events and technical developments, we cover all facets of the digital asset space with unwavering commitment to timely, relevant information.

Related Articles


- Ripple Bets On AI Boom With Strategic Investment In AI Agent Infrastructure Startup
- Prediction Market News: Kalshi Fines MrBeast Associate Over Insider Trading Amid State Crackdown
- CLARITY Act: Banks, Crypto Yet To Agree On New Crypto Bill Draft As March 1 Deadline Looms
- Michael Saylor Predicts $50T From Bonds Could Flow Into Bitcoin Ecosystem as Digital Credit Evolves
- Bitcoin Treasury Firm GD Culture Authorizes Sale of 7,500 BTC as Expert Warns Of More ‘Pain’
- Dogecoin, Cardano, and Chainlink Price Prediction As Crypto Market Rebounds
- Will Solana Price Rally to $100 If Bitcoin Reclaims $72K?
- XRP Price Eye $2 Rebound as On-Chain Data Signals Massive Whale Accumulation
- Ethereum Price Reclaims $2K- New Rally Ahead or a Temporary Bounce?
- COIN Stock Price Prediction as Wall Street Pros Forecast a 62% Surge
- Cardano Price Signals Rebound as Whales Accumulate 819M ADA


