 Buy $GGs
How To Trade This Bullish Pattern Emerged In Polygon Coin Chart


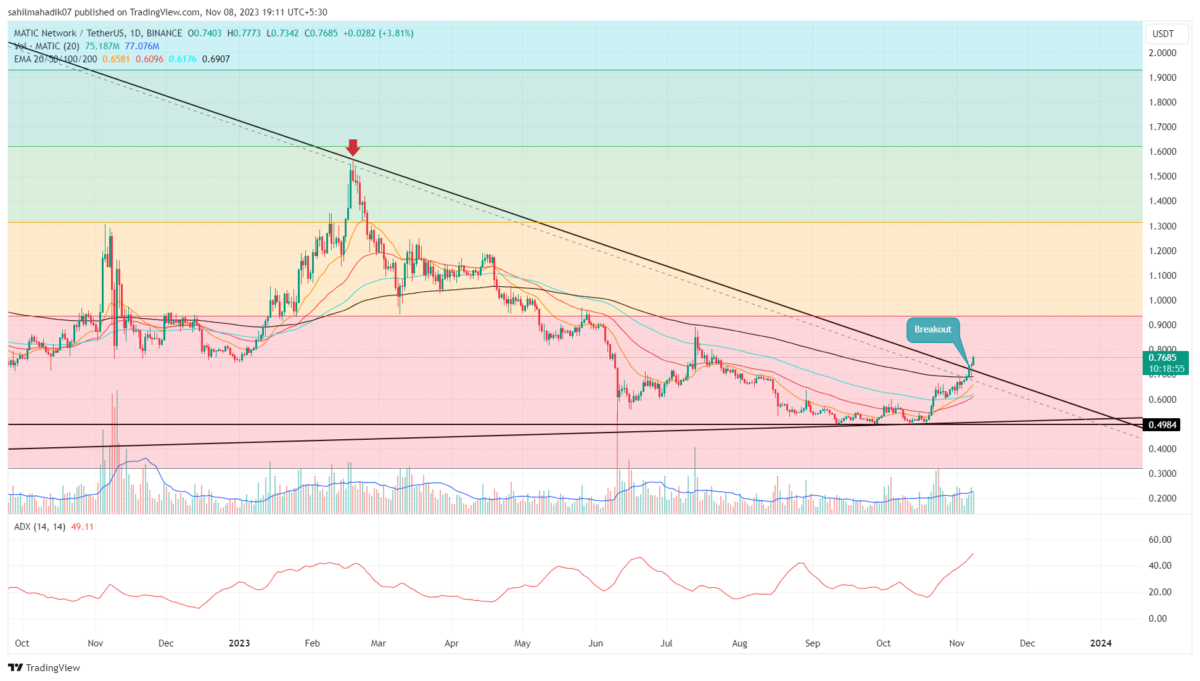
Following a direction rally from June to August, the Polygon Coin price reverted from the $1-$1.02 barrier. Since then, the altcoin has been in a downward spiral forming new lower highs and lower lows. Connecting this swing, the daily technical chart showcased the formation of a flag pattern.
Key points
- The MATIC/USDT will extend its downfall until the prices remain under the downsloping trendline.
- The multiple barriers at $0.75 validate it as a strong supply zone.
- The intraday trading volume in the MATIC is $748.3 Million, indicating a 24.5% gain.
 Source- –Tradingview
A flag pattern is a bullish continuation pattern that offers a long entry opportunity for a minor correction. Under the patterns influence, the Polycoin coin price retracement 50% of the previous rally and plunged to a low of $0.69.
On September 22nd, the polygon coin price rebounded from the support trendline and triggered a new bull cycle within this falling wedge. The altcoin shows 10.5% growth within a fortnight and has repeatedly retested the $0.75 resistance.
The higher price rejection candle at his resistance indicates the sellers vigorously defend this level. However, if the buyers managed to breach this resistance, the coin price would rise 6 to 8% to hit the downsloping trendline.
Until the altcoin is below this trendline, the Polygon coin price will remain trapped in a correction phase and could witness more losses.
However, per the technical setup, the bullish pattern should eventually encourage buyers to break the resistance trendline. Doing so will replenish the bullish momentum and drive the prices to $0.875, followed by $1.
Technical Indicators
Bollinger band indicator: the coin price trading below the neutral line indicates the sellers are currently controlling the price. Moreover, this midline at $0.75 is an added barrier against buyers.
MACD indicator: a bullish crossover between the fast and slow line gives an additional confirmation for a $0.75 breakout.
Polygon Coin Price Intraday Levels
- Spot rate: $0.78
- Trend: Bullish
- Volatility: Medium
- Resistance levels- $0.75 and $0.875
- Support levels- $0.726 and $0.7
Play 10,000+ Casino Games at BC Game with Ease
- Instant Deposits And Withdrawals
- Crypto Casino And Sports Betting
- Exclusive Bonuses And Rewards


Why Trust CoinGape
CoinGape has covered the cryptocurrency industry since 2017, aiming to provide informative insights Read more…to our readers. Our journal analysts bring years of experience in market analysis and blockchain technology to ensure factual accuracy and balanced reporting. By following our Editorial Policy, our writers verify every source, fact-check each story, rely on reputable sources, and attribute quotes and media correctly. We also follow a rigorous Review Methodology when evaluating exchanges and tools. From emerging blockchain projects and coin launches to industry events and technical developments, we cover all facets of the digital asset space with unwavering commitment to timely, relevant information.

Related Articles


- Peter Brandt Flips Bullish, Predicts Bitcoin Rally As Price Holds Above $70k
- XRP News: Institutional Use Case Expands as Doppler Finance Integrates WXRP for Multi-Chain Access
- Trump Tariffs: Bitcoin Faces Fresh Headwinds as 15% Global Tariffs Begin This Week Amid Iran War
- Bitget Unveils ‘Crypto Anti-Bias Pledge’ To Support Women’s Inclusion In Crypto
- U.S.-Iran War: Crypto Market Rebounds as Iran Reportedly Reaches Out To U.S. To End Conflict
- Dogecoin Price Outlook as BTC Recovers Above $73,000
- XRP Price Prediction as Iran-U.S. Peace Talks Trigger a Crypto Rally
- COIN Stock Analysis as Bitcoin Retests $72k Ahead of February NFP Data
- Robinhood Stock Price Prediction As Cathie Wood Buys $12M Dip in Bold ARK Move
- Bitcoin Price At Risk? Professor Who Predicted US-Iran War Says America Could Lose
- Gold Price Prediction March 2026: Rally, Crash, or Record Highs?


