
HYPE Price Jumps 8% as Open Interest Hits $1.61B — Is $50 Next?


Highlights
- HYPE price rebounds as chart structure confirms a completed reversal pattern.
- Rising Open Interest signals expanding participation during the recovery phase.
- Technical structure supports a stronger long-term HYPE price prediction outlook.
HYPE price surged over 8% in the past 24 hours as the price action shifts into a cleaner structure. The chart shows a distinct response by one of the key support areas that influenced the recent market behavior.
The market took a rounded base where buyers intervened to provide the larger picture with a constructive tilt. This change is following a period of volatility compression that has been in a long-term downward trend.
HYPE Price Forms a Clear Reversal Structure
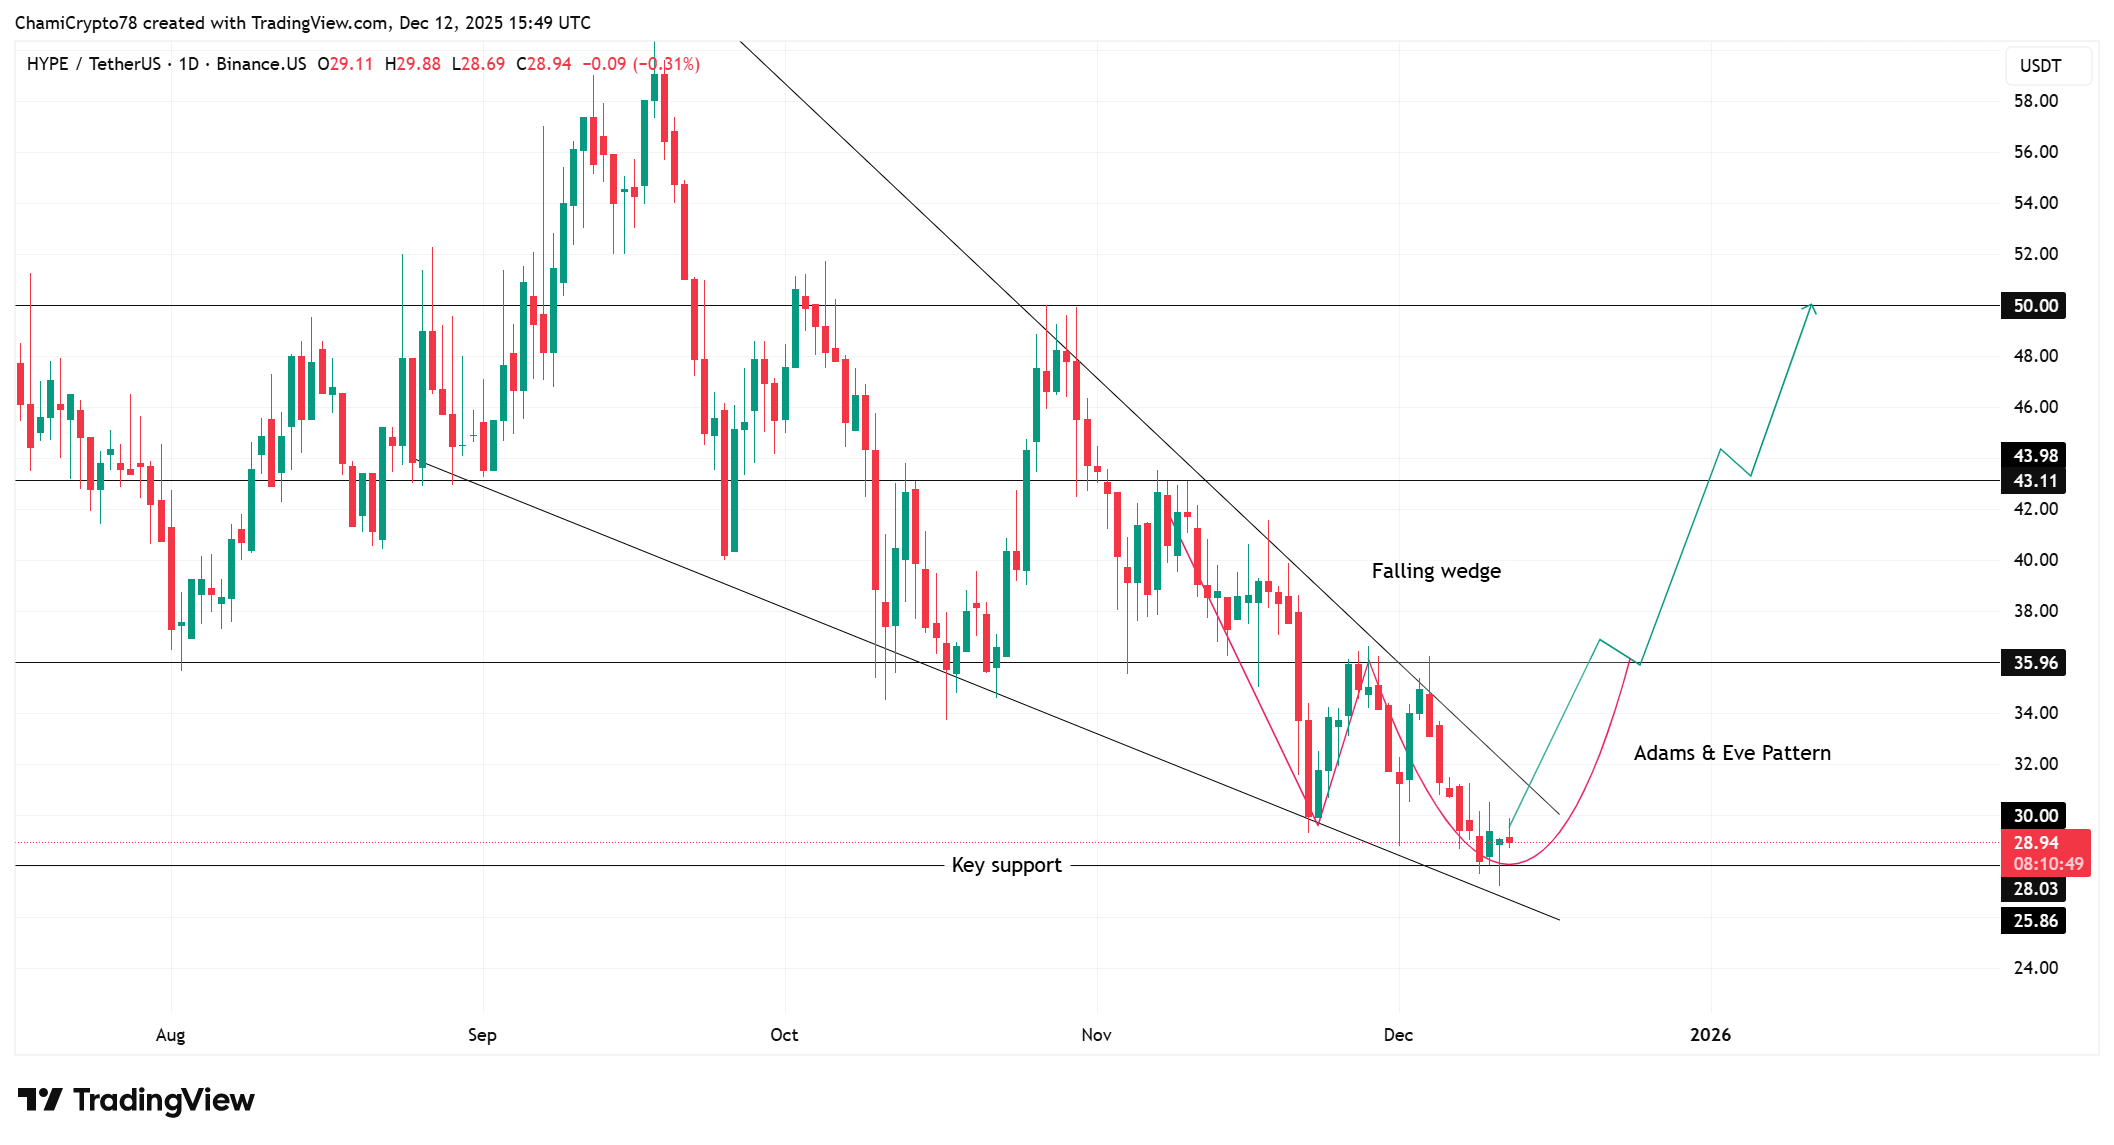
The HYPE price chart reveals a decisive shift after weeks of forced selling. At the time of writing, HYPE price trades around $29, creating a constructive base inside a well-defined falling wedge.
This trend was created following the repetitive tests of the support zone around $28 and every test attracted more solid reactions. The right side of an Adams and Eve structure is now developed to provide buyers with a cleaner structure in order to build control in the short term.
Meanwhile, the breakout attempt aligns with a series of higher lows that formed near wedge support. Every pivot formed a distinct recovery rhythm and the chart honors this rhythm with great accuracy. Breaking above $35.96 will open clean traffic to $43.11 where price was rejected previously.
Furthermore, continuation above this midpoint zone gives the chart space to attempt the $50 target. The building justifies this perception since the trend grew without being distorted. Altogether, the chart forms the basis for a stronger long-term HYPE price prediction.
Rising Open Interest Reinforces HYPE’s Recovery Setup
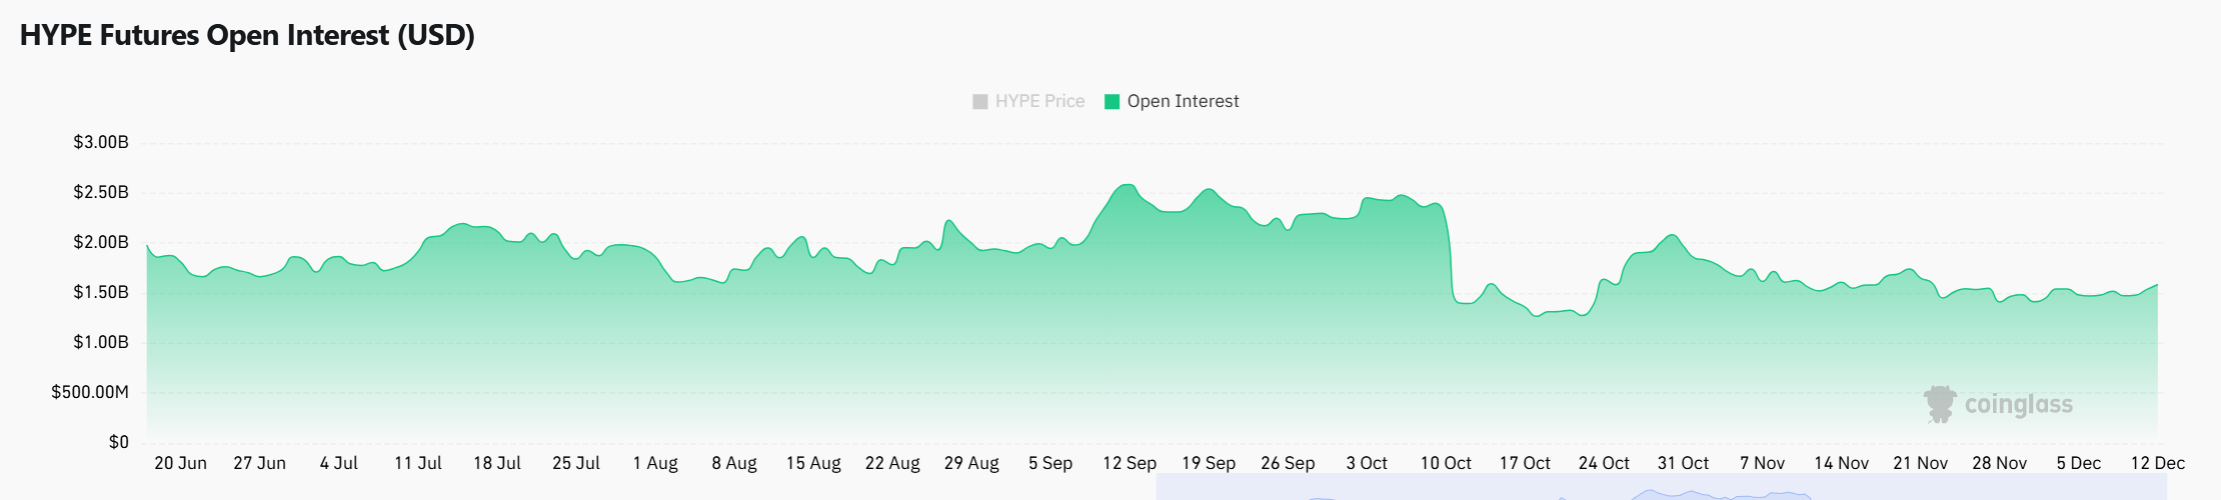
Open Interest climbed 7.78% to $1.61B, giving the HYPE price rebound strong confirmation. This growth is an indication of a gradual growth in participation as the market develops a new structure.
Notably, Open Interest grew while price reclaimed higher ground, showing constructive alignment between positioning and direction. This alignment is significant as traders are likely to develop exposure as structure enhances.
In particular, the recent growth was in a base-formation stage, which restricts distortions of forced exits. New positioning also increased towards the wedge boundary indicating clean engagement as opposed to defensive responses. Meanwhile, rising OI near resistance zones shows that traders back continuation attempts instead of fading rallies. This behavior supports sustained strength in the Hyperliquid price cycle.
Furthermore, OI expansion with higher lows often strengthens breakout attempts because liquidity thickens above key thresholds.
As the price stabilizes at around $29, the participants are no longer retreating into the structure. OI behavior coupled with chart alignment helps the larger HYPE goal of $50.
To sum up, HYPE has developed a structure that is conducive to upward continuation provided that support is provided. The growth of Open Interest reinforces this arrangement since the participation increases in constructive periods.
The set-up also coincides with a strong breakout towards higher levels. With control in the hands of the buyers, HYPE has space to reach the $50 target.
Play 10,000+ Casino Games at BC Game with Ease
- Instant Deposits And Withdrawals
- Crypto Casino And Sports Betting
- Exclusive Bonuses And Rewards

Frequently Asked Questions (FAQs)
1. How does chart structure influence market confidence?
2. What is driving recent activity on Hyperliquid?
3. Why is Open Interest important for HYPE analysis?

Why Trust CoinGape
CoinGape has covered the cryptocurrency industry since 2017, aiming to provide informative insights Read more…to our readers. Our journal analysts bring years of experience in market analysis and blockchain technology to ensure factual accuracy and balanced reporting. By following our Editorial Policy, our writers verify every source, fact-check each story, rely on reputable sources, and attribute quotes and media correctly. We also follow a rigorous Review Methodology when evaluating exchanges and tools. From emerging blockchain projects and coin launches to industry events and technical developments, we cover all facets of the digital asset space with unwavering commitment to timely, relevant information.


- Crypto Market Recovers as Expert Warns U.S. Easing of Iran Sanctions Won’t Stabilize Oil Prices
- CLARITY Act May Still Delay Despite Stablecoin Yield Deal, Galaxy’s Alex Thorn Warns
- MSTR, COIN, HOOD Stock Prices Crash As FED Rate Hike Odds Climb to 50% in 2026
- US Congress Schedules Tokenization Hearing Next Week as CLARITY Act Advances
- Breaking: CLARITY Act Advances as Senate and White House Reach Deal On Stablecoin Yields
- Ethereum, XRP, and Solana Price Prediction As CLARITY Act Advances After Senate–White House Deal
- Why is Pi Network Price Up Today (March 21) Despite Market Wide Correction?
- Bittensor (TAO) Price Surges 20% After Nvidia CEO Comments
- Dogecoin, Shiba Inu, and Pepe Coin Price Prediction If BTC Holds $70k Level
- Cardano (ADA) Price Prediction Amid SEC/CFTC Policy Shift and ETF Update
- Crypto Stock to Watch As Bitcoin Price Crashed Below $70k; CRCL, COIN, MSTR, HOOD


