Is Binance Coin Price Heading for Major Correction? Bearish Pattern Sparks Fear of 20% Dip


After the early June Sell-off, the Binance coin price witnessed a minor relief rally in the daily time frame. For over a month, the coin price has been rising with new sets of higher highs and lows with a parallel channel. However, this bullish tick is part of a larger bearish pattern called an inverted flag indicating the BNB price is poised for a major correction.
Also Read: Binance Burns Binance Coin (BNB) Worth $480 Million
Binance Coin Daily Chart
- A breakdown from the flag pattern’s support trendline could release the buildup selling pressure in the BNB price
- The $220 and $200 stand as crucial supports for coin buyers
- The intraday trading volume in the BNB coin is $596.5 Million, indicating a 17.5% loss
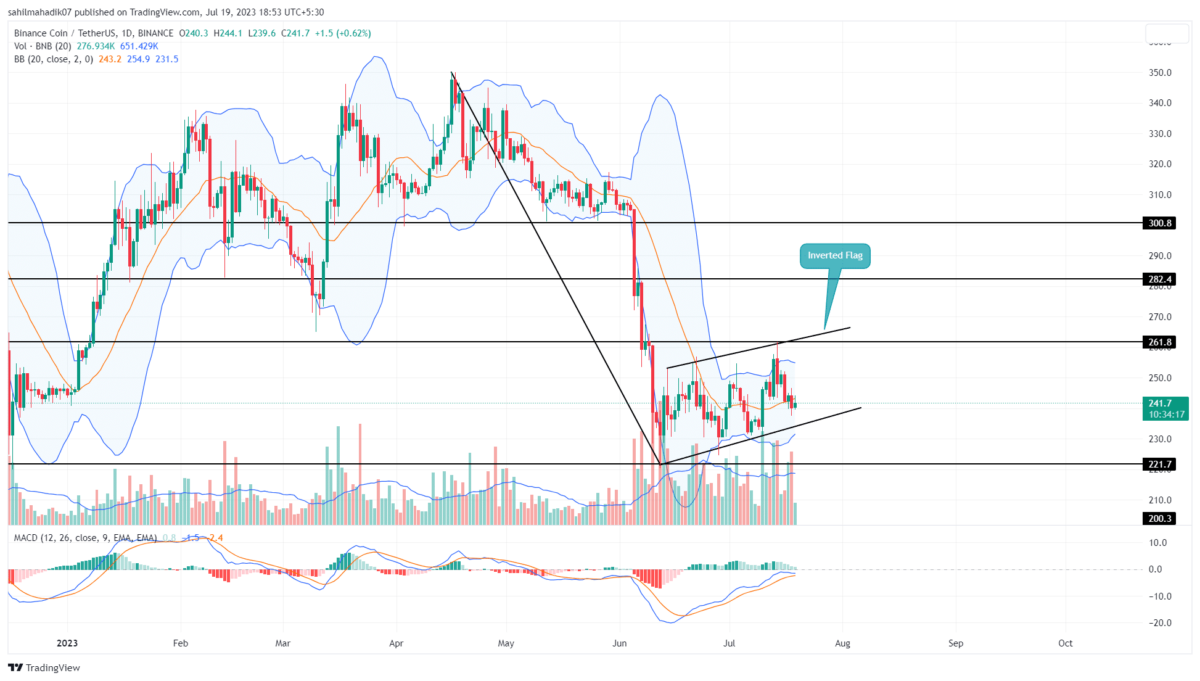
 Source- Tradingview
In the daily time frame chart, the Binance coin price shows the formation of an inverted flag pattern. This bearish continuation pattern consists of a sharp downturn followed by a temporary relief rally which replenishes the exhausted bearish momentum.
Thus, the current recovery in BNB price can be considered a short relief rally poised for a significant correction. By the press time, this altcoin trades at $241 and is revisiting the lower trendline of the channel.
A crackdown below the channel pattern’s support trendline with daily candle closing will replenish the selling momentum. The post-breakdown downfall will tumble the BNB price back to $220, followed by $200.
Can BNB Price Revisit $285?
While a bearish outlook of the BNB price seems reasonable, the increased accumulation from buyers for discounted prices could be the overhead trendline. This possible breakout will offset the bearish thesis and could bolster buyers to restart a fresh recovery. If the bullish momentum rises, the coin buyers could lead a rally to the $285 mark.
- Bollinger Band: A narrow range of Bollinger Band indicator reflects increasing volatility in the Binance coin price
- Moving Average Convergence/Divergence: The MACD(blue) and signal(orange) slopes nearing a bearish crossover will signal the recovering selling momentum

Why Trust CoinGape
CoinGape has covered the cryptocurrency industry since 2017, aiming to provide informative insights Read more…to our readers. Our journal analysts bring years of experience in market analysis and blockchain technology to ensure factual accuracy and balanced reporting. By following our Editorial Policy, our writers verify every source, fact-check each story, rely on reputable sources, and attribute quotes and media correctly. We also follow a rigorous Review Methodology when evaluating exchanges and tools. From emerging blockchain projects and coin launches to industry events and technical developments, we cover all facets of the digital asset space with unwavering commitment to timely, relevant information.

Related Articles


- Bitcoin vs Gold Feb 2026: Which Asset Could Spike Next?
- Top 3 Reasons Why Crypto Market is Down Today (Feb. 22)
- Michael Saylor Hints at Another Strategy BTC Buy as Bitcoin Drops Below $68K
- Expert Says Bitcoin Now in ‘Stage 4’ Bear Market Phase, Warns BTC May Hit 35K to 45K Zone
- Bitcoin Price Today As Bulls Defend $65K–$66K Zone Amid Geopolitics and Tariffs Tensions
- COIN Stock Price Prediction: Will Coinbase Crash or Rally in Feb 2026?
- Shiba Inu Price Feb 2026: Will SHIB Rise Soon?
- Pi Network Price Prediction: How High Can Pi Coin Go?
- Dogecoin Price Prediction Feb 2026: Will DOGE Break $0.20 This month?
- XRP Price Prediction As SBI Introduces Tokenized Bonds With Crypto Rewards
- Ethereum Price Rises After SCOTUS Ruling: Here’s Why a Drop to $1,500 is Possible


