 Buy $GGs
Is Bitcoin Market Value Dropping Below $18800?


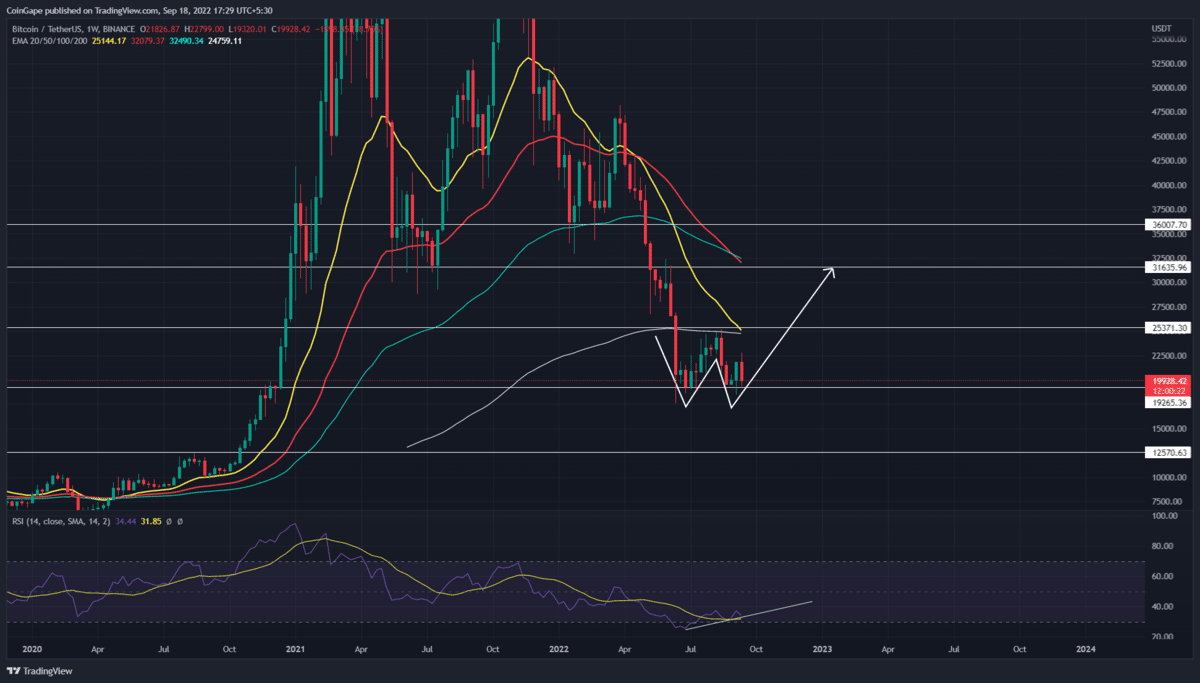
The Bitcoin weekly chart shows the price is well supported at the $19000-$18800 demand zone. Last week the coin price rebounded from this support with a morning star candle pattern showing a possibility of forming a double bottom pattern.
Key points
- The Bitcoin price could retest the $20500 level as potential resistance before falling to $18800
- The weekly chart shows an evident bullish divergence in the RSI chart
- The intraday trading volume in Bitcoin is $24.9 Billion, indicating a 14.5% loss
 Source-Tradingview
The aforementioned reversal pattern can replenish the bullish momentum and trigger a new recovery rally. A bullish breakout from the $25000 neckline could provide a bull run to the $31700.
However, the recent CPI data released impacted the Bitcoin market value negatively. Thus, prices will likely retest the buyer’s commitment at the $19000-$18800 support.
Anyhow, if the Bitcoin price sustains above this support, the bullish pattern will remain intact, and so does the recovery theory.
Willy Woo Hints Bitcoin Market Value has not Bottomed Yet
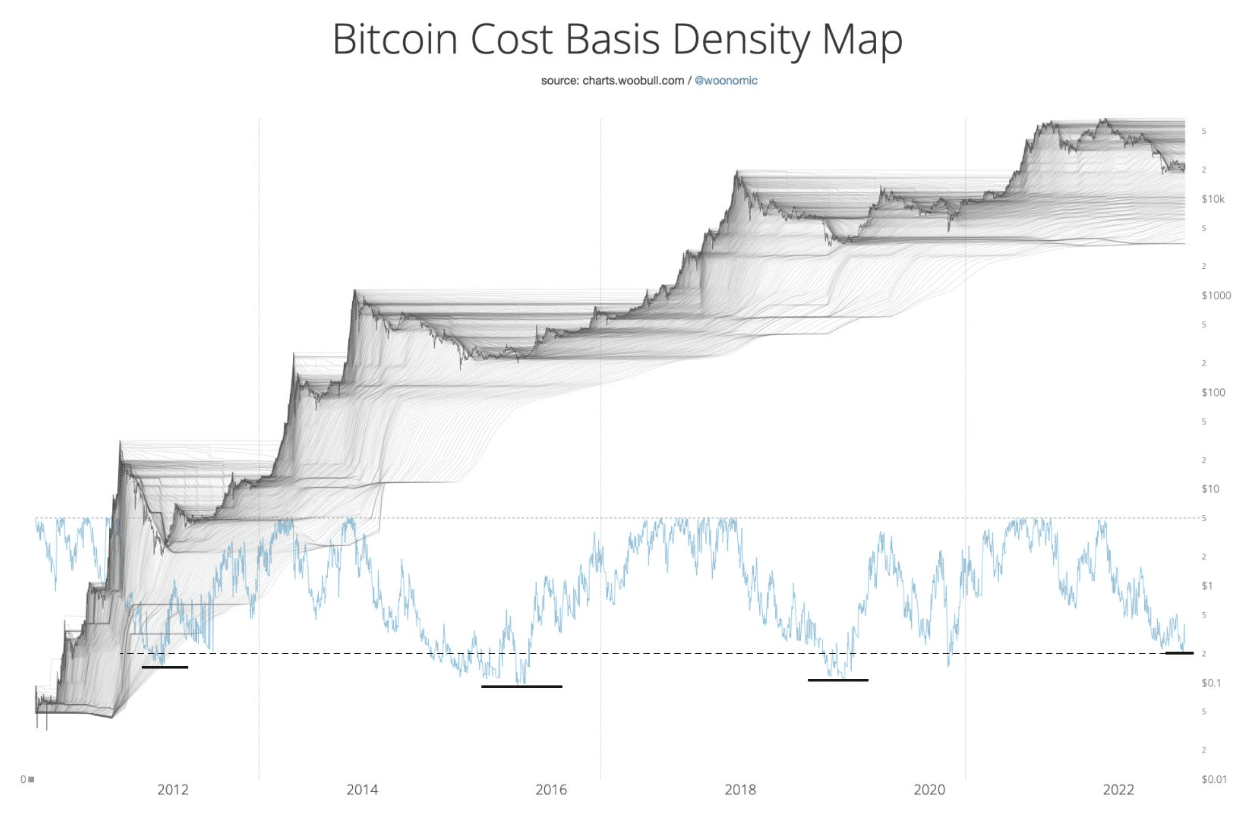 Renowned On-chain analyst Willy Woo recently posted a series of tweets, sharing why the bitcoin value has not yet bottomed. One of the indicators we are likely to highlight is the ‘Cost Basis Density Map.’
In this chart, the Blue line represents the percentage of losses the coin witnessed. Thus, Analyst Willy woo said, “In terms of max pain, the market has not felt the same pain as prior bottoms.”
The tweet accentuated that currently, only 52% of coins are underwater. However, the prior bottoms were 61%, 64%, and 57%.
Thus, if the selling pressure persists and breaches the $18800 support, the next crucial support zone would be at $12250.
Technical indicator
EMAs: the weekly EMAs bolster the resumption of the prior downtrend with the bearish crossover of 50 and 100 EMAs and the potential crossover of 20 and 200 EMAS.
Relative strength index: A bullish divergence in daily-RSI indicates strength in bullish momentum. Thus, the rising indicator slope hints at a price reversal or extended consolidation above the $19000-$18000 support.
- Resistance level- $22550 and $25000
- Support level- $19600 and $19000-$18000
Play 10,000+ Casino Games at BC Game with Ease
- Instant Deposits And Withdrawals
- Crypto Casino And Sports Betting
- Exclusive Bonuses And Rewards


Why Trust CoinGape
CoinGape has covered the cryptocurrency industry since 2017, aiming to provide informative insights Read more…to our readers. Our journal analysts bring years of experience in market analysis and blockchain technology to ensure factual accuracy and balanced reporting. By following our Editorial Policy, our writers verify every source, fact-check each story, rely on reputable sources, and attribute quotes and media correctly. We also follow a rigorous Review Methodology when evaluating exchanges and tools. From emerging blockchain projects and coin launches to industry events and technical developments, we cover all facets of the digital asset space with unwavering commitment to timely, relevant information.

Related Articles


- Bitget Unveils Upgrade For Stock, Gold Trading Alongside Crypto As Part Of Universal Exchange Push
- ChangeNOW Is Settling Crypto Swaps in Under a Minute.
- $3B Western Union Expands Into Crypto With USDPT Stablecoin Launch on Solana
- XRP News: Key Ripple Whale Indicator Turns Bullish After Months, Price Rally Ahead?
- Crypto Market Today: BTC, ETH, XRP, SOL, and DOGE Rally as Geopolitical Tensions Ease
- Pi Network Price As BTC Rallies Above $74K: Can PI Coin Extend Gains to $0.30?
- XRP Price As Bitcoin Reclaims $74K- Is $5 Next?
- Dogecoin Price Outlook as BTC Recovers Above $73,000
- XRP Price Prediction as Iran-U.S. Peace Talks Trigger a Crypto Rally
- COIN Stock Analysis as Bitcoin Retests $72k Ahead of February NFP Data
- Robinhood Stock Price Prediction As Cathie Wood Buys $12M Dip in Bold ARK Move


