Is Bitcoin Price Drop to $29000 a Warning Sign or Buying Opportunity?


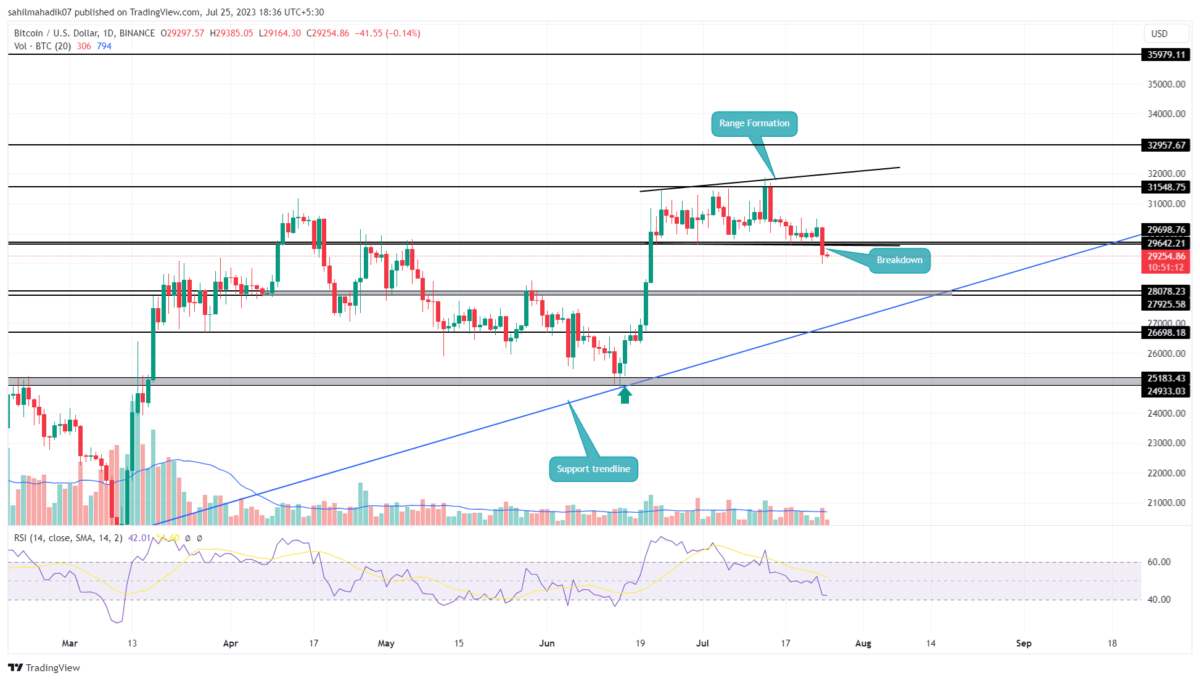
The Bitcoin price traded sideways over a month and created an uncertain sentiment in the crypto market. This range was limited between the two diverging trendlines showcasing the formation of a megaphone pattern. However, with a recent downtick in the market sentiment, the BTC price gave a bearish breakdown from the supported trendlines of the aforementioned range reflecting a potential downfall in the near future. However, is this breakdown enough to go bearish on Bitcoin?
Also Read: Crypto Slowly Losing Edge Over US Equities Amid Bitcoin Price Retreat
Bitcoin Price Daily Chart
- A bearish breakdown from the $28640 support sets the BTC price for a 5% drop
- A long-coming support trendline maintains the overall bullish trend.
- The intraday trading volume in Bitcoin is $11.7 Billion, indicating a 14.7% loss.
 Source- Tradingview
On July 24th, the Bitcoin price gave a high momentum breakdown from the bottom trendline at $28640 support. The long consolidation ending in the seller’s favor reflects an upcoming downfall in BTC price.
As of now, the largest cryptocurrency Bitcoin traded at 29230 with an entire loss of 0.22%. Interested traders can look to sell the opportunity at this point or wait for a pullback to $29230. This retest would validate price sustainability at lower prices and offer a better entry opportunity.
If the coin price sustains this breakdown, the sellers could drive a downfall of 4 to 5% and test the $28000 psychological support.
[converter id=”btc-bitcoin” url=”https://coingape.com/price/converter/btc-to-usd/”]
Time to Sell Bitcoin?
Considering the bigger picture, the anticipated correction would still be a part of a longer uptrend. Therefore a retest to the $28000 support would also meet the ascending support trendline carrying a recovery phase in Bitcoin price for the past seven months. Until the support trendline is intact, the coin holders can maintain the bullish outlook and also look for an opportunity to reaccumulate.
- Bollinger Band: the Bitcoin price challenging the lower band of the Bollinger band indicator indicates high momentum in selling activity
- Relative Strength Index: A bearish divergence in the daily RSI slope started reflecting weakness in bullish. however, a breakdown below the 40% mark will also offer an additional edge to market sellers.

Why Trust CoinGape
CoinGape has covered the cryptocurrency industry since 2017, aiming to provide informative insights Read more…to our readers. Our journal analysts bring years of experience in market analysis and blockchain technology to ensure factual accuracy and balanced reporting. By following our Editorial Policy, our writers verify every source, fact-check each story, rely on reputable sources, and attribute quotes and media correctly. We also follow a rigorous Review Methodology when evaluating exchanges and tools. From emerging blockchain projects and coin launches to industry events and technical developments, we cover all facets of the digital asset space with unwavering commitment to timely, relevant information.

Related Articles


- CLARITY Act: Trump’s Crypto Adviser Says Stablecoin Yield Deal Is “Close” as March 1 Deadline Looms
- Trump Tariffs: U.S. To Impose 10% Global Tariff Following Supreme Court Ruling
- CryptoQuant Flags $54K Bitcoin Risk As Trump Considers Limited Strike On Iran
- Why Is Bitdeer Stock Price Dropping Today?
- Breaking: U.S. Supreme Court Strikes Down Trump Tariffs, BTC Price Rises
- Ethereum Price Rises After SCOTUS Ruling: Here’s Why a Drop to $1,500 is Possible
- Will Pi Network Price See a Surge After the Mainnet Launch Anniversary?
- Bitcoin and XRP Price Prediction As White House Sets March 1st Deadline to Advance Clarity Act
- Top 3 Price Predictions Feb 2026 for Solana, Bitcoin, Pi Network as Odds of Trump Attacking Iran Rise
- Cardano Price Prediction Feb 2026 as Coinbase Accepts ADA as Loan Collateral
- Ripple Prediction: Will Arizona XRP Reserve Boost Price?


