
Is Cardano Price Breakdown below $0.3 an Opportunity for Higher Gains?


Within a month, the Cardano price has shown aggressive correction in the daily time frame chart. From the $0.3793 high on July 14th, the coin price tumbled a 23% drop and reached the current trading price of $0.23. However, the falling price has started showing a falling wedge pattern which hints at the maturity of a downward trend; is this the right time to buy?
Also Read: Cardano Welcomes New Updates as Transaction Count Tops 73M
Key Points From Cardano Analysis
- A falling wedge pattern shapes the current downfall in ADA price
- A bullish breakout from the overhead trendline would set the ADA price for a 13.5% upswing
- The intraday trading volume in the ADA coin is $120.6 Million, indicating a 27% gain.
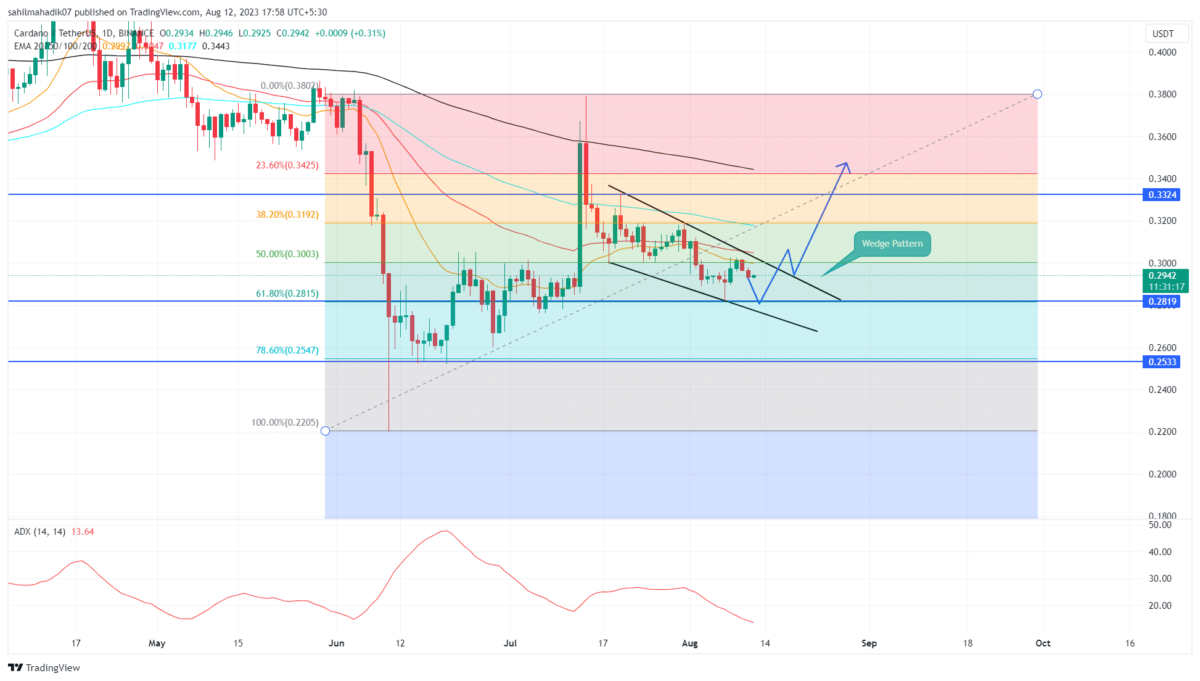
 Source- Tradingview
On August 7th, the falling Cardano price witnessed strong support at the confluence point for 61.8% Fibonacci Retracement level and a lower trendline of the wedge pattern. In theory, the aforementioned FIB level is indeed strong support but after the breakdown of the 50% retracement level, the coin holders must remain cautious.
Thus, the bullish reversal pushed the price to 7% to rechallenge the overhead resistance trendline. Currently, the ADA price trades at $0.294 and may continue its downward trend until the two converging trend lines are intact.
A potential breakout from the overhead resistance will surge the coin price 13.45% higher to reach the $0.332 mark.
[converter id=”ada-cardano” url=”https://coingape.com/price/converter/cardano-to-usd/?amount=1″]
Will ADA Price Extend Correction Phase?
While the opportunity of a bullish upswing seems in favor, the increasing FUD in overall market sentiment cannot be ignored. If the overhead supply pressure rises, a breakdown below the wedge pattern’s lower trendline will provide sellers with an additional barrier to pressurize buyers. This breakdown could prolong the correction phase to $0.255.
- Average Direction Index: The falling ADX price may reflect the weakening bullish momentum.
- Exponential Moving Average: The coin price trading below the daily EMAs(20, 50, 100, and 200) indicates the path to least resistance for traders is downward.
Play 10,000+ Casino Games at BC Game with Ease
- Instant Deposits And Withdrawals
- Crypto Casino And Sports Betting
- Exclusive Bonuses And Rewards


Why Trust CoinGape
CoinGape has covered the cryptocurrency industry since 2017, aiming to provide informative insights Read more…to our readers. Our journal analysts bring years of experience in market analysis and blockchain technology to ensure factual accuracy and balanced reporting. By following our Editorial Policy, our writers verify every source, fact-check each story, rely on reputable sources, and attribute quotes and media correctly. We also follow a rigorous Review Methodology when evaluating exchanges and tools. From emerging blockchain projects and coin launches to industry events and technical developments, we cover all facets of the digital asset space with unwavering commitment to timely, relevant information.


- Michael Saylor Hints at Another Strategy Bitcoin Buy With ‘Stretch the Orange Dots’ Post
- Will CLARITY Act Pass in 2026? Galaxy’s Alex Thorn Warns April Deadline Is Critical
- Tom Lee’s Bitmine Adds 5,000 ETH Despite $7.5B Unrealized Loss as BMNR Stock Rebounds
- CLARITY Act Should Ban Stablecoin Yields to Advance in Senate, French Hill Says
- U.S. Set to Deploy Warships to Keep the Strait of Hormuz Open, Bitcoin Climbs
- Solana vs XRP Price Forecast: Can SOL Reclaim Its All-Time High Before XRP Hits $2?
- Top Analyst Predicts Cardano Price Could Surge 100% As Bitcoin Breaks $72k
- What’s Keeping Shiba Inu Below $0.0000065- Analyst Predicts 30% Rise Ahead
- BTC Price to $100K by 2026? Kalshi and Polymarket Odds Climb to 42%
- Why Pi Network Price Surged 30% Today?
- What Happens to XRP Price If US Wins War Against Iran?


