Is Ethereum Price Starting a New Recovery Rally As Per Elliott Wave?


As per the Elliot wave theory, the major downfall in Ethereum which started in November 2021 is a three-wave correction. The Elliott Wave Theory is a technical analysis approach used to predict future price movements in financial markets and is based on the idea that market prices move in repetitive patterns or waves, driven by the collective psychology of investors. From the November 2021 peak of $4951, the coin price tumbled around 82% to mark a $883 low in June 2022. If the wave counts are corrected, the ETH price could start a new impulse wave.
Also Read: Bitwise Revises Bitcoin Futures ETF To Bitcoin And Ether Strategy ETF
Ethereum Price Daily Chart
- A channel pattern carries the current recovery rally in the ETH price
- The Ethereum Fear and Greed Index at 49 reflects a neutral sentiment in the market.
- The intraday trading volume in Ether is $3.25 Billion, indicating a 23.6% loss.
 Source- Tradingview
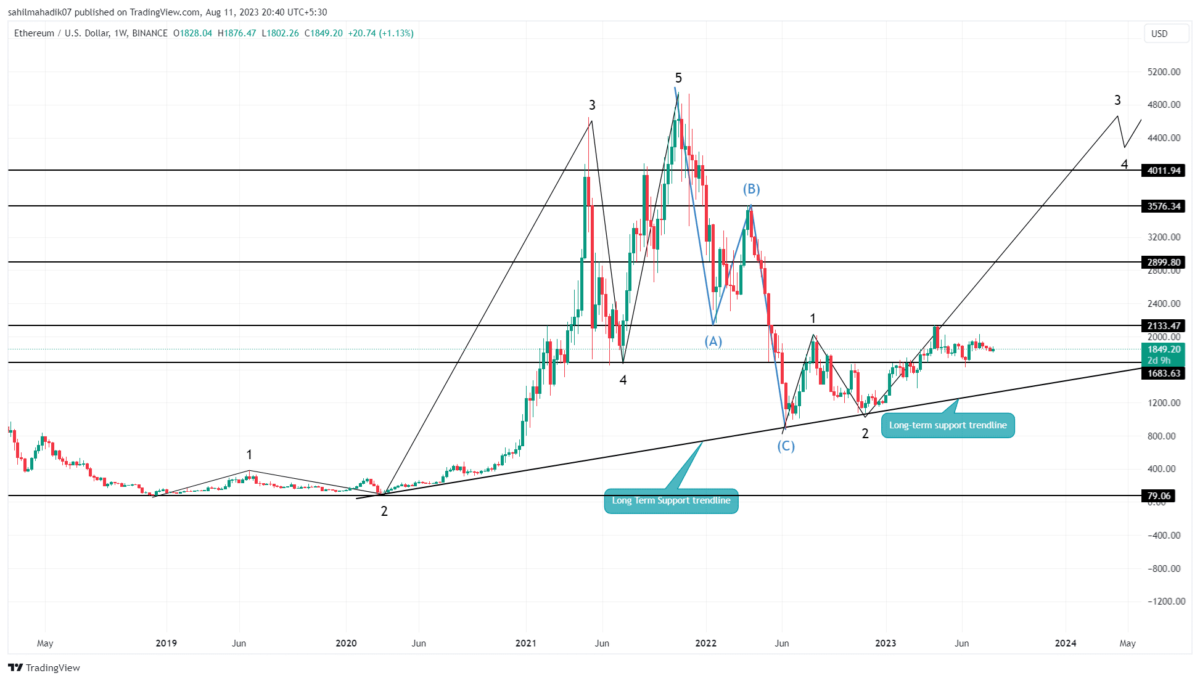
Considering the first wave of impulse started from the June 2022 low of $883 to August 2022 at $2029, the second wave(correction) retraced to around 78.6% Fibonacci retracement level and bottomed around $1074.
A bullish upswing initiated from this low could be the third wave of an impulsive trend. In theory, the third wave is referred to as the most powerful and dynamic phase of a market trend.
As per the Fibonacci extension tool, the 3rd wave could be Wave 1 x 1.62%, 2.62%, or 4.25%. Thus, the potential target for Ethereum price could be $2900, $4010, or $5830 respectively.
[converter id=”eth-ethereum” url=”https://coingape.com/price/converter/eth-to-usd/?amount=1″]
Can ETH Price Rally to $2500?
 Source- Tradingview
By the press time, the Ethereum price traded at $1853 with an intraday gain of 0.08%. The daily time frame chart shows the ETH price is resonating in a rising channel pattern. Amid the ongoing correction, the coin price would retest the support trendline to recuperate the bullish momentum. A potential reversal from this trendline would bolster buyers for a rally to $2500 registering a 35% growth. Crypto holders can maintain a strong bullish sentiment until the channel pattern is intact.
- Exponential Moving Average: The Ethereum price above 200-day EMA reflects the long-term trend of bullish
- Relative strength index: The daily RSI slope rises above 40% indicates reflect a suitable scenario for a bullish upswing

Why Trust CoinGape
CoinGape has covered the cryptocurrency industry since 2017, aiming to provide informative insights Read more…to our readers. Our journal analysts bring years of experience in market analysis and blockchain technology to ensure factual accuracy and balanced reporting. By following our Editorial Policy, our writers verify every source, fact-check each story, rely on reputable sources, and attribute quotes and media correctly. We also follow a rigorous Review Methodology when evaluating exchanges and tools. From emerging blockchain projects and coin launches to industry events and technical developments, we cover all facets of the digital asset space with unwavering commitment to timely, relevant information.

Related Articles


- Breaking: CME Group To Launch 24/7 BTC, ETH, XRP, SOL Futures Trading On May 29
- White House to Hold CLARITY Act Meeting With Ripple, Coinbase, Banks Today
- Senator Warren Warns Fed Against Bitcoin Crash Rescue Amid Liquidity Pump Claims
- Top 5 Reasons Ethereum Price Is Down Today
- Crypto Market Slides as Hawkish FOMC Minutes Trigger BTC, ETH, XRP Sell-Off
- Cardano Price Prediction Feb 2026 as Coinbase Accepts ADA as Loan Collateral
- Ripple Prediction: Will Arizona XRP Reserve Boost Price?
- Dogecoin Price Eyes Recovery Above $0.15 as Coinbase Expands Crypto-Backed Loans
- BMNR Stock Outlook: BitMine Price Eyes Rebound Amid ARK Invest, BlackRock, Morgan Stanley Buying
- Why Shiba Inu Price Is Not Rising?
- How XRP Price Will React as Franklin Templeton’s XRPZ ETF Gains Momentum


