 Buy $GGs
Is UNI Price Recovery Possible At 50% Retracement Level?


A V-shaped recovery initiated from the June bottom support of $3.36 pushed the UNI price 190% higher and formed a local top at $9.82. However, after a nearly three-week attempt to surpass this resistance, the bullish momentum exhausted and triggered a significant price correction.
Key points from UNI analysis:
- The ongoing correction is plunged to the 0.5 Fibonacci retracement level
- The daily RSI slope dives deeper into bearish territory, indicating increasing fear in market participants
- The 24-hour trading volume in the Uniswap token is $178.2 Million, indicating a 22.3% gain.
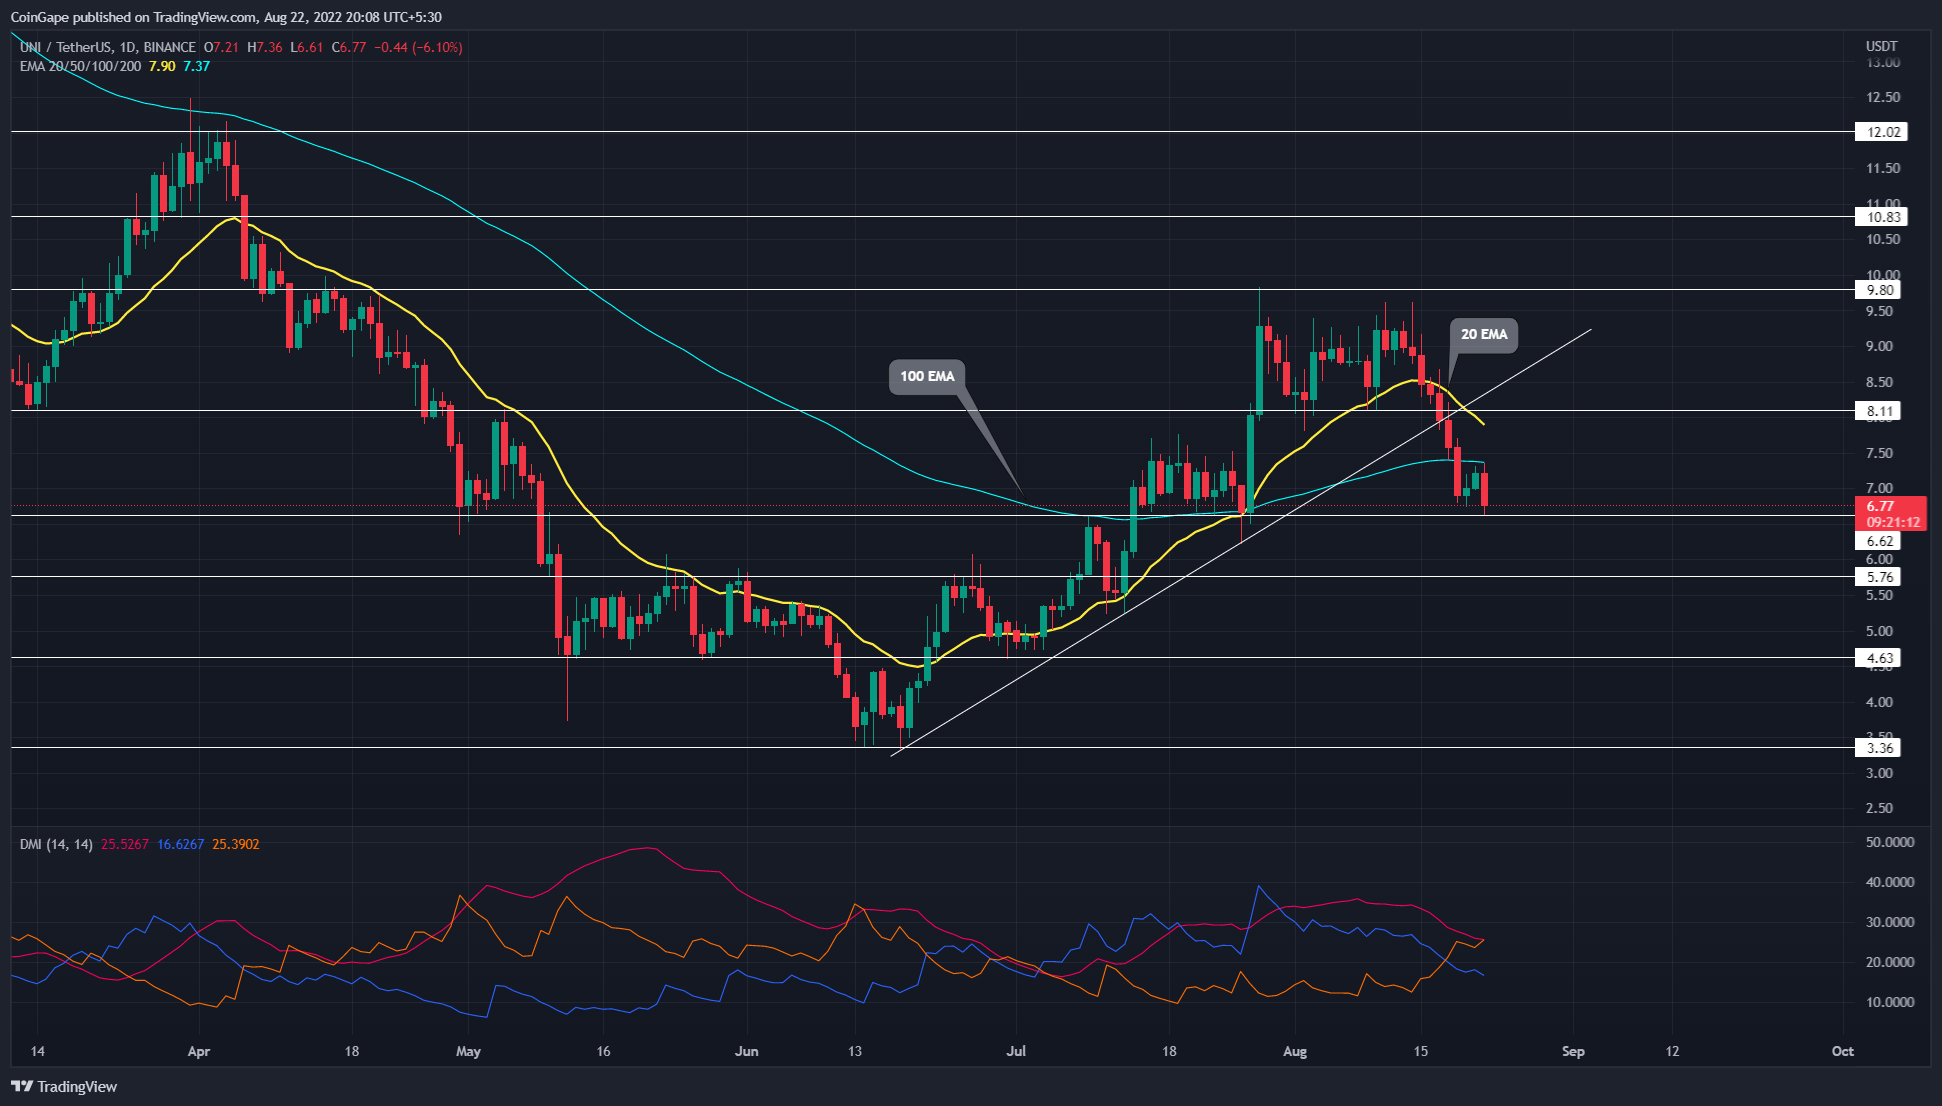 Source-Tradingview
Last week, the increased selling activities in the crypto market resulted in a sharp fall in most of the altcoins. The UNI price action depicts a similar trend resulting in the fallout of multiple support levels.
The Uniswap token market price plunged after failing to sustain above the 20 days EMA and facing constant rejection from the $9.50 resistance level. That downtrend last week accounts for a price dump of 26% resulting in the fallout of a long-coming support trendline.
The combined support of $6.6 and 0.5 FIB cushions the falling prices for a 4.5% recovery over the weekend. However, the prevailing bear trend gains momentum with the start of a new week resulting in a 5.2% price drop.
With the increased selling pressure, the UNI prices may soon break below the $6.75 support level and test the next horizontal level of $5.90. The downtrend will account for a 12% decrease in market value and endanger the bullish dominance at the psychological mark of $5.0.
However, if buyers manage to contain the selling pressure, a sideways trend above the $6.75 horizontal level can be expected. Moreover, in the best-case scenario, a bullish reversal retesting the $8.0 breakout is also possible.
Technical indicator
EMAs: the coin price nosedive below the trend-defining 100-day EMA indicates the bears are in control. Moreover, the 20-day EMA flipped to viable resistance level.
DMI indicator: the DI lines give a bearish crossover with a drop in the ADX line, reflecting weakness in the previous bullish momentum. However, a positive turnaround in the ADX line will represent an increase in bearish trend momentum.
- Resistance levels- $8.11, $9.8
- Support levels are $6.62 and $5.76
Play 10,000+ Casino Games at BC Game with Ease
- Instant Deposits And Withdrawals
- Crypto Casino And Sports Betting
- Exclusive Bonuses And Rewards


Why Trust CoinGape
CoinGape has covered the cryptocurrency industry since 2017, aiming to provide informative insights Read more…to our readers. Our journal analysts bring years of experience in market analysis and blockchain technology to ensure factual accuracy and balanced reporting. By following our Editorial Policy, our writers verify every source, fact-check each story, rely on reputable sources, and attribute quotes and media correctly. We also follow a rigorous Review Methodology when evaluating exchanges and tools. From emerging blockchain projects and coin launches to industry events and technical developments, we cover all facets of the digital asset space with unwavering commitment to timely, relevant information.

Related Articles


- Ethereum Co-founder Sparks $157M Sell-Off Fears as ETH Struggles Below $2k
- Analyst Predicts XRP Price Could Fall to $1 as XRP ETFs Record Net Weekly Outflows
- U.S.-Iran War: Trump Threatens to Hit Iran ‘Very Hard’ Today as Bitcoin Faces New Selling Pressure
- Crypto Market Weekly Recap: US-Iran War Steer Crypto Prices, Kraken Gets Fed Master Account, Tokenization Push March 2-6
- Bitcoin Price Faces Further Crash as Whales Liquidates Recently Bought BTC: Report
- Dogecoin, Pepe coin, and Shiba Inu Price Prediction As BTC Crashes Below $70k
- Here’s Why Cardano Price Has Not Reclaimed $0.30
- Will XRP Price Crash as U.S. Nonfarm Payrolls Fell by 92,000 in February?
- Pi Network Price Eyes a 40% Surge as Pi Day Looms on March 14
- Top Reasons Why Circle Stock Price is Surging
- Gold Price Prediction as US-Iran War Hits the Second Week


