 Buy $GGs
Is Worldcoin Price Ready to Bounce Back? Chart Pattern Hints a Rally to $3


After the massive rally witnessed on the July 24th launch date, the Worldcoin(WLD) witnessed a sharp reversal to stabilize its price action. By the press time, the WLD price trades at $2.35 and is roughly 68% down from its market debut peak of $7.50. Currently, the price trend has turned sideways wobbling around the $2 mark. Will the recovery continue after this consultation?
Also Read: Worldcoin (WLD) Under Probe by French Regulators
Worldcoin Price Daily Chart
- A broadening wedge pattern leads the current rally in Worldcoin price
- A positive crossover between the 50-and-100-day EMA slope could accelerate the buying pressure among traders.
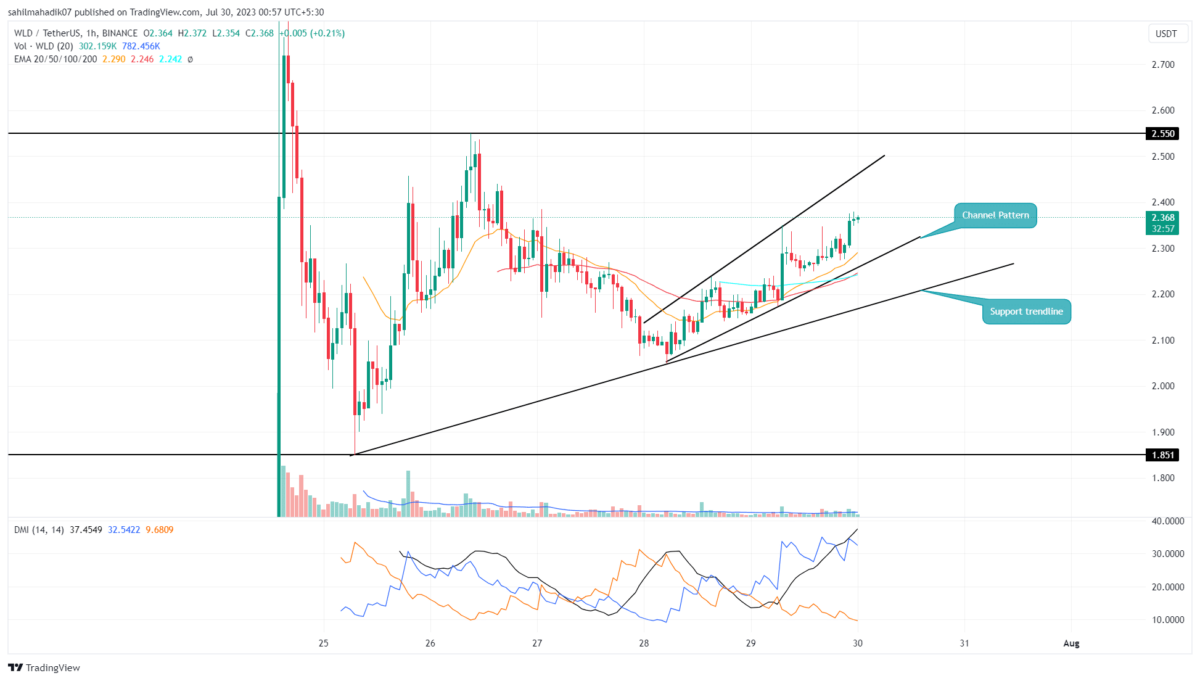
- The intraday trading volume in Worldcoin is $155.6 Million, indicating a 6.5% loss.
 Source- Tradingview
The Worldcoin price clearly reflects a sideways trend with the higher low and lower high formation in the hourly time frame chart. After the recent price surge, this consolidation is crucial for a sustained bullish trend as it could absorb the build-up selling pressure, and check sustainability at higher levels.
As of now, the coin price shows a steady recovery rally under the influence of a broadening channel pattern. The prices are constantly wiggling with rising trend lines and approaching the $2.55 swing high resistance.
If the chart pattern remains intact, and offers dynamic support to coin buyers, the WLD price could challenge the $2.55 for a bullish breakout. Reclaiming this swing high would be an early sign for uptrend continuation and may drive a rally to the next significant resistance around $2.92-$3.
Can Worldcoin Price Plunge Back to $1.85?
The hourly chart shows the two rising trendlines are currently supporting the Worldcoin price rally. The steeper one is the lower trendline of the broadening channel and the second is drawn connecting the lows of July 25th and 28th. Considering a pessimistic situation, a breakdown below the channel support trendline will be an early sign of the continuation of the sideways trend, However, a crackdown below the longer trendline could prolong the correction phase and may plunge the Worldcon price back to $1.85
- Exponential moving average: The rising EMAs(20, 50, 100, and 200) offer additional support to a rising price.
- Directional Movement Index: A significant gap between the DI+(blue) and DI-(orange) slope in a positive crossover state indicates bullish momentum is aggressive.
Play 10,000+ Casino Games at BC Game with Ease
- Instant Deposits And Withdrawals
- Crypto Casino And Sports Betting
- Exclusive Bonuses And Rewards


Why Trust CoinGape
CoinGape has covered the cryptocurrency industry since 2017, aiming to provide informative insights Read more…to our readers. Our journal analysts bring years of experience in market analysis and blockchain technology to ensure factual accuracy and balanced reporting. By following our Editorial Policy, our writers verify every source, fact-check each story, rely on reputable sources, and attribute quotes and media correctly. We also follow a rigorous Review Methodology when evaluating exchanges and tools. From emerging blockchain projects and coin launches to industry events and technical developments, we cover all facets of the digital asset space with unwavering commitment to timely, relevant information.

Related Articles


- Peter Brandt Flips Bullish, Predicts Bitcoin Rally As Price Holds Above $70k
- XRP News: Institutional Use Case Expands as Doppler Finance Integrates WXRP for Multi-Chain Access
- Trump Tariffs: Bitcoin Faces Fresh Headwinds as 15% Global Tariffs Begin This Week Amid Iran War
- Bitget Unveils ‘Crypto Anti-Bias Pledge’ To Support Women’s Inclusion In Crypto
- U.S.-Iran War: Crypto Market Rebounds as Iran Reportedly Reaches Out To U.S. To End Conflict
- XRP Price Prediction as Iran-U.S. Peace Talks Trigger a Crypto Rally
- COIN Stock Analysis as Bitcoin Retests $72k Ahead of February NFP Data
- Robinhood Stock Price Prediction As Cathie Wood Buys $12M Dip in Bold ARK Move
- Bitcoin Price At Risk? Professor Who Predicted US-Iran War Says America Could Lose
- Gold Price Prediction March 2026: Rally, Crash, or Record Highs?
- RIOT Stock Prediction as Needham, Piper Sandler Slash Target After Earnings


