 Buy $GGs
Litecoin Price: With a 12% Surge and Pearson BTC Correlation at –0.01, Is LTC Gearing Up for $125?


Highlights
- Litecoin price forms a clean reversal pattern with buyers targeting the $125 region.
- Improving DMI readings and a midline test enhance the long-term Litecoin outlook.
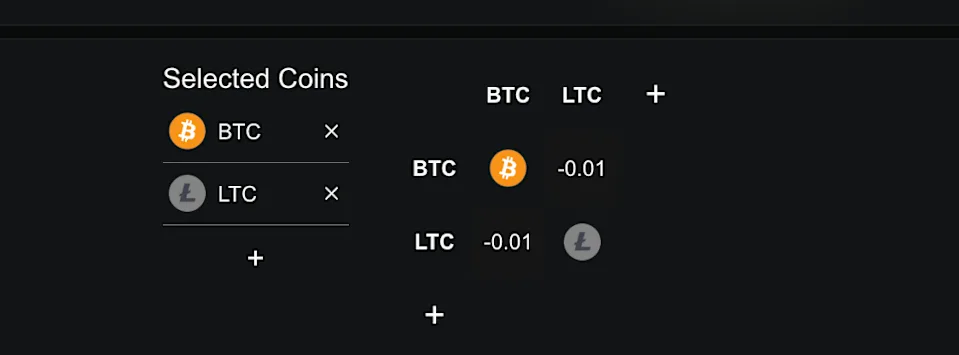
- Pearson BTC correlation drops to –0.01, giving Litecoin unusual independence this week.
The Litecoin price continues to move with notable stability while the broader market struggles to find direction. Several U.S.-based assets dropped sharply this month, yet LTC price held key support zones with surprising consistency. This contrast highlights how Litecoin behaves differently during uncertain market phases.
Meanwhile, many traders still wait for stronger signals from larger assets before entering new positions. Litecoin now forms clean structures that hint at a possible shift that deserves deeper review.
Reversal Structure Reinforces Litecoin Price Strength
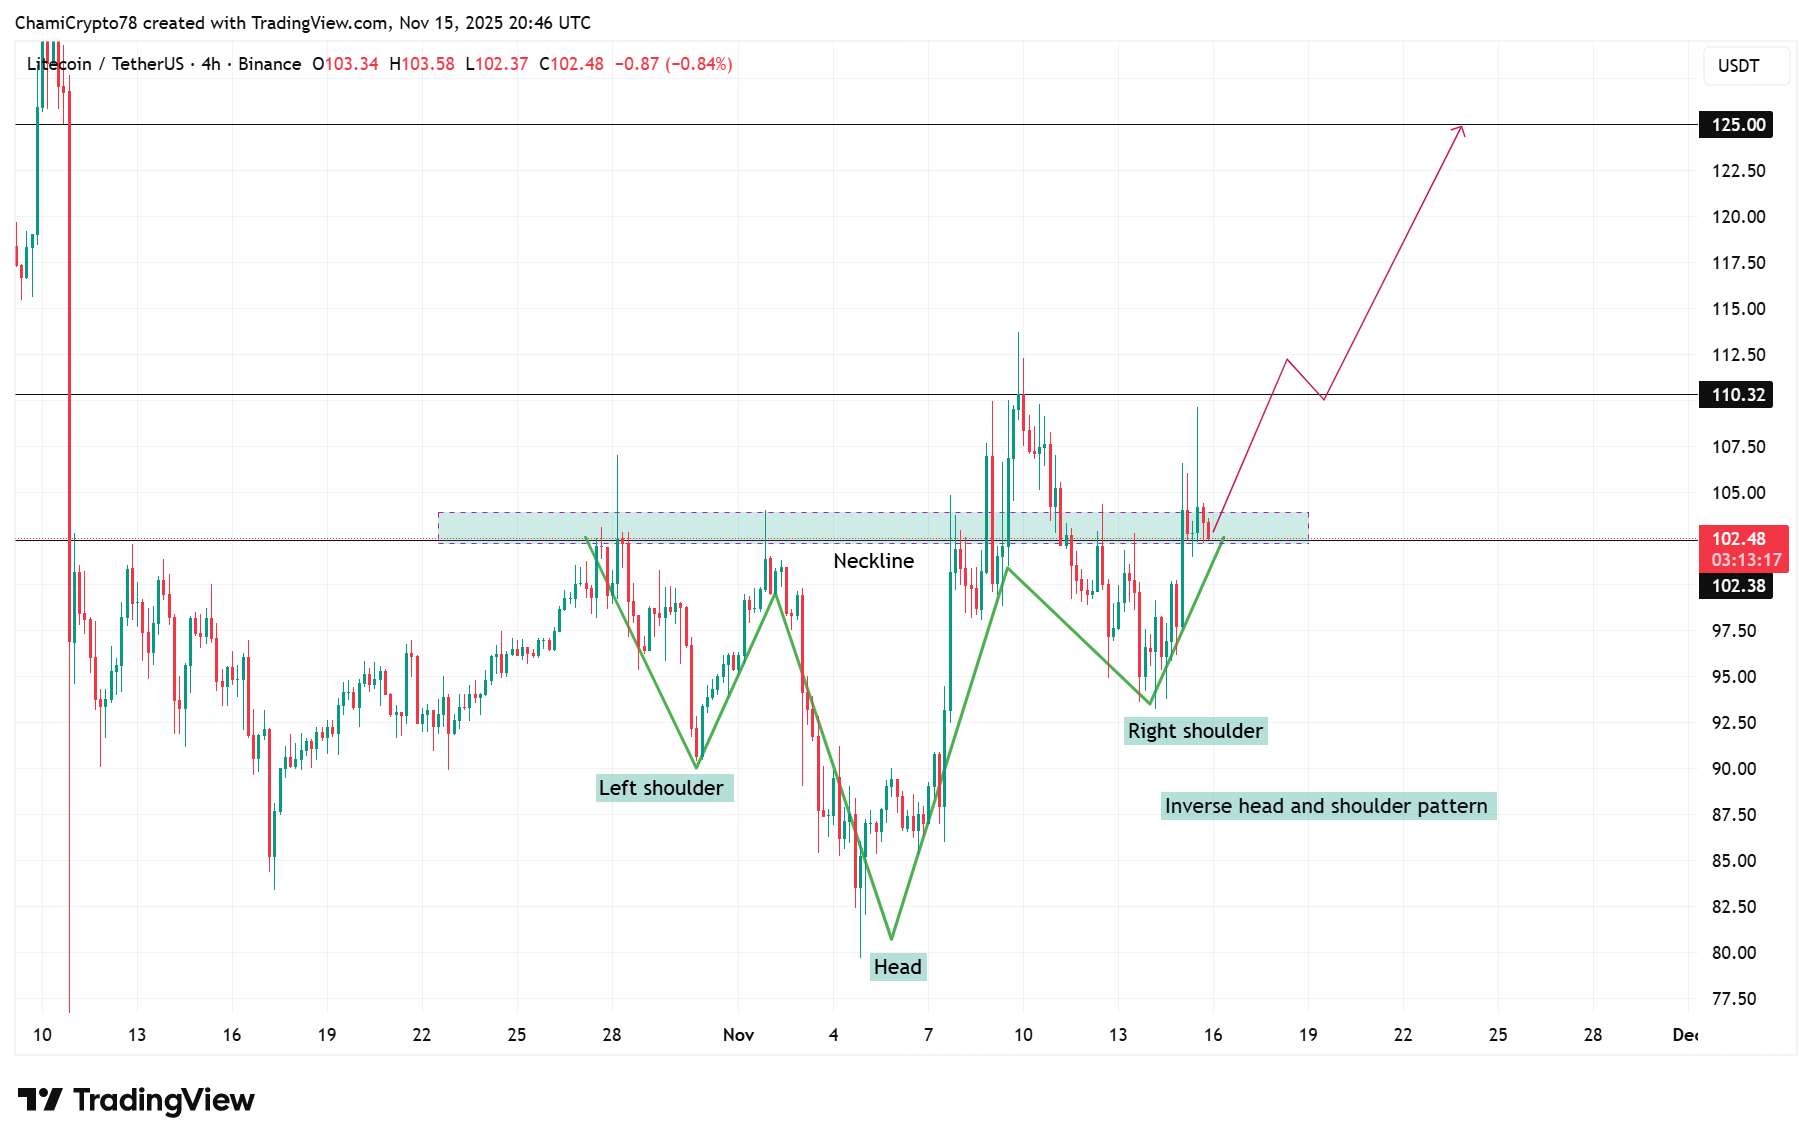
The Litecoin price sits inside a clear reversal pattern that now attracts stronger interest after several weeks of hesitation. At the time of press, Litecoin value trades at $102.48 after climbing from the deep correction near $92.
The inverse head and shoulder formation is unique since every component was created with accuracy throughout the four-hour chart. The left shoulder was developed around the lows in late-October and the head was developed as the buyers defended the area at $82. The right shoulder subsequently took shape around the $94 mark indicating a more pronounced response that favors the changing trend.
Notably, Litecoin price reclaimed the neckline at $102.38, which now forms a strong defensive zone. Meanwhile, buyers watch the $110.32 level because a clean break unlocks the measured target near $125. This increased target becomes credible because more and more lower levels are being built under this construction.
Improving Trend Signals a Stronger Litecoin Outlook
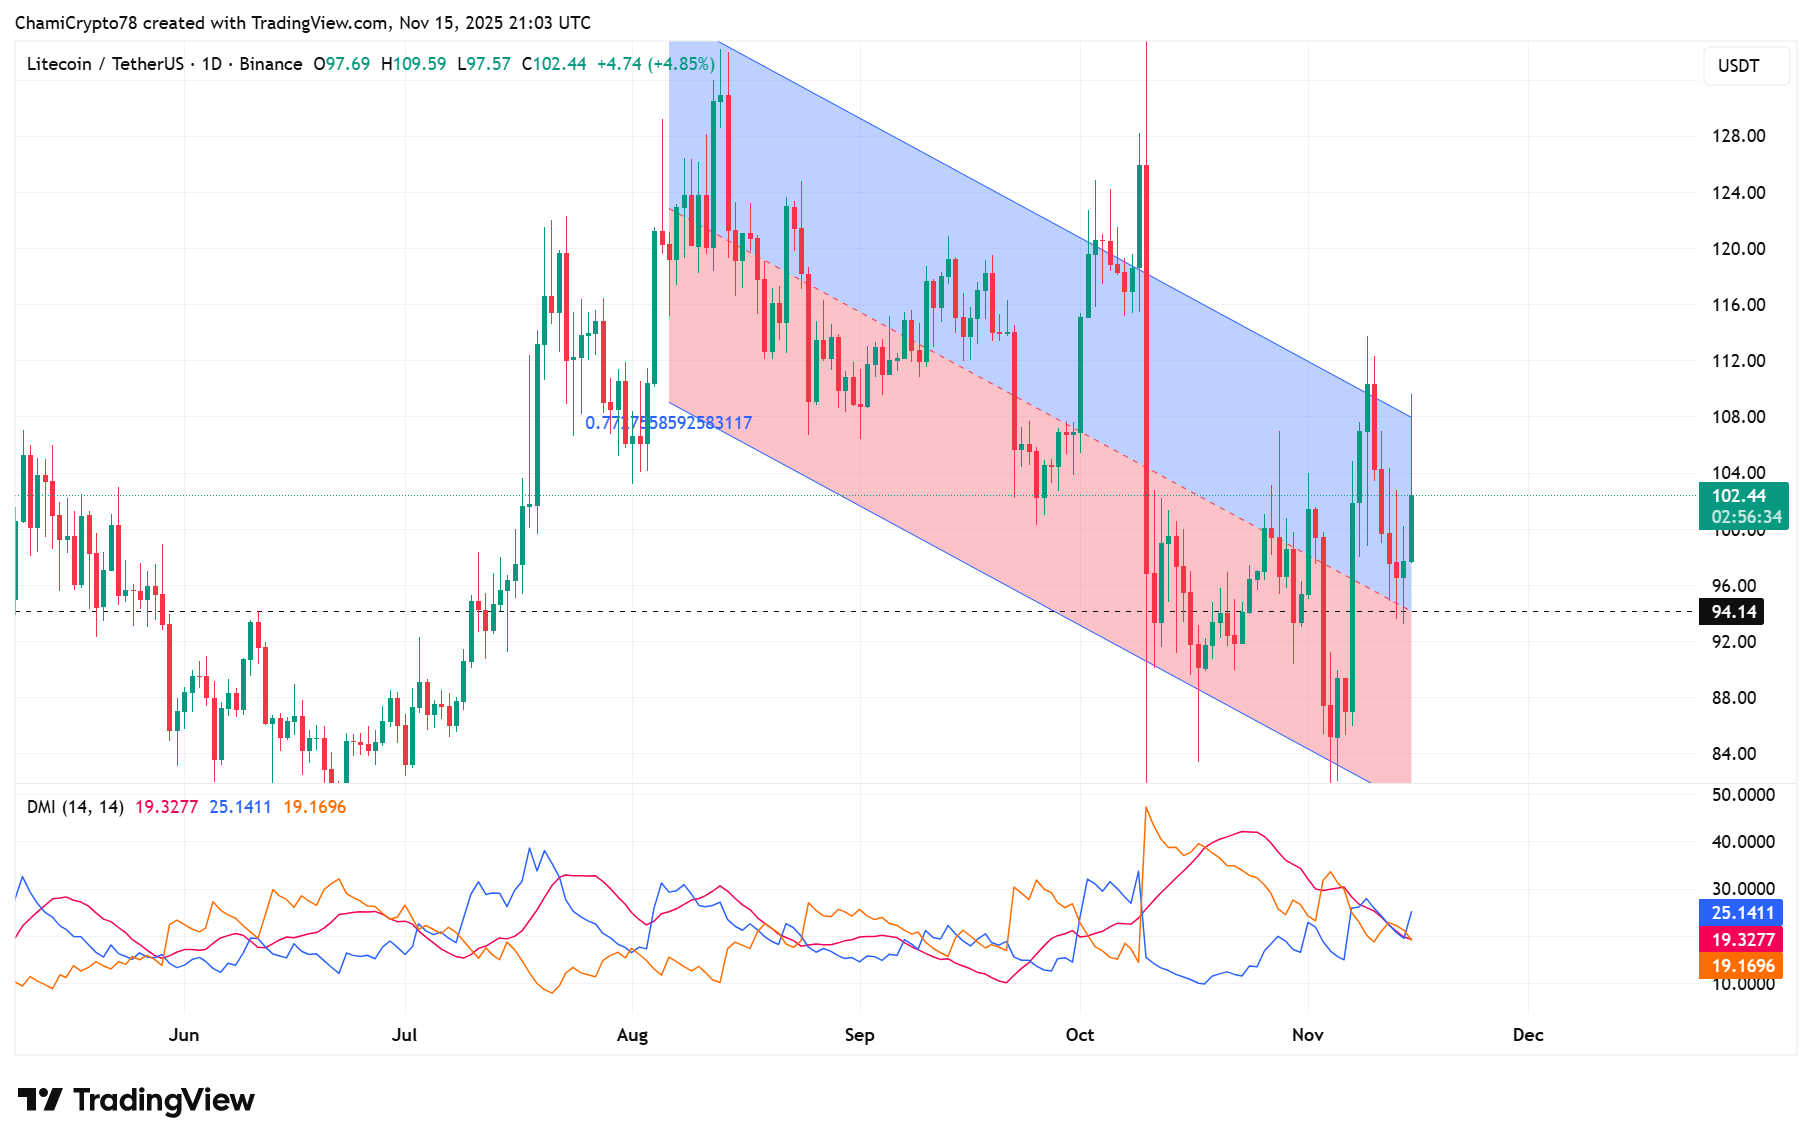
The price responses were directed by the regression trend channel on the daily chart, which had to go through some weeks of downward pressure. However, Litecoin price now presses toward the channel’s midline after a clean rebound from the lower boundary.
Besides, the Directional Movement Index (DMI) strengthens this shift because it evaluates trend strength through its three components. Notably, the +DI at 25 shows improving buy pressure as price climbs through recent candles.
Meanwhile, the -DI at 19 reflects reduced sell influence after the earlier correction. Moreover, the ADX at 19 is an indication of a trend that gains momentum and not decelerating.
These readings support the broader Litecoin long-term price outlook because they align with the channel’s structural improvement. This action will make a more receptive atmosphere to a possible shift to the higher levels, such as the extended target at about $125.
Negative BTC Correlation Gives Litecoin an Edge
Litecoin price gained extra attention after its Pearson correlation with Bitcoin fell to -0.01. This reading indicates that both assets are heading in opposite directions instead of creating a common ground.
Notably, this separation helped LTC price hold its structure while Bitcoin slipped below $100K despite the U.S. government reopening. Meanwhile, this independence gave Litecoin breathing room during a period filled with deeper swings across larger assets.
Specifically, the negative correlation supported stronger reactions near important structural levels, including the neckline reclaim. The shift also encouraged more interest because Litecoin behaved differently from the broader market.
These circumstances contribute to the preparation of the further rise, particularly in case the structure is located above the neckline and is directed toward the next important area of about $125.
To sum up, Litecoin price now benefits from a rare mix of structural and behavioral strengths. The reversal pattern and neckline reclaim is a sign of a direction to greater heights. The regression trend and DMI readings support the better conditions. The Pearson correlation shift adds a clear behavioral edge that strengthens the case for a push toward $125.
Play 10,000+ Casino Games at BC Game with Ease
- Instant Deposits And Withdrawals
- Crypto Casino And Sports Betting
- Exclusive Bonuses And Rewards

Frequently Asked Questions (FAQs)
1. Why is the DMI indicator important for Litecoin analysis?
2. How does the regression trend help interpret Litecoin’s structure?
3. What does a negative Pearson correlation indicate for Litecoin?

Why Trust CoinGape
CoinGape has covered the cryptocurrency industry since 2017, aiming to provide informative insights Read more…to our readers. Our journal analysts bring years of experience in market analysis and blockchain technology to ensure factual accuracy and balanced reporting. By following our Editorial Policy, our writers verify every source, fact-check each story, rely on reputable sources, and attribute quotes and media correctly. We also follow a rigorous Review Methodology when evaluating exchanges and tools. From emerging blockchain projects and coin launches to industry events and technical developments, we cover all facets of the digital asset space with unwavering commitment to timely, relevant information.

Related Articles


- CLARITY Act: Stablecoin Yield Debate Heats Up, but March 1 Deadline Not ‘Do or Die’
- Best Institutional Custody Solutions for Tokenized Assets in 2026
- Minnesota Considers Ban on Bitcoin and Crypto ATMs as Scam Reports Rise
- Breaking: Morgan Stanley Applies For Crypto-Focused National Trust Bank With OCC
- Ripple Could Gain Access to U.S. Banking System as OCC Expands Trust Bank Services
- Top Analyst Predicts Pi Network Price Bottom, Flags Key Catalysts
- Will Ethereum Price Hold $1,900 Level After Five Weeks of $563M ETF Selling?
- Top 2 Price Predictions Ethereum and Solana Ahead of March 1 Clarity Act Stablecoin Deadline
- Pi Network Price Prediction Ahead of Protocol Upgrades Deadline on March 1
- XRP Price Outlook As Jane Street Lawsuit Sparks Shift in Morning Sell-Off Trend
- Dogecoin, Cardano, and Chainlink Price Prediction As Crypto Market Rebounds


