Loopring Price Analysis: $0.37 Breakdown May Slump LRC to June Low


Over the past two months, the Loopring (LRC) price has wobbled in a descending triangle pattern. Moreover, the coin price has recently retested the falling trendline, which may trigger another bear cycle within this pattern. The expected downfall reached neckline support of $0.33. But what next?
Key points:
- The LRC price has dropped 5% over the past five days.
- The daily-RSI slope shows an evident divergence concerning price action.
- The 24-hour trading volume in the Loopring coin is $143.5 Million, indicating a 189.6% gain.
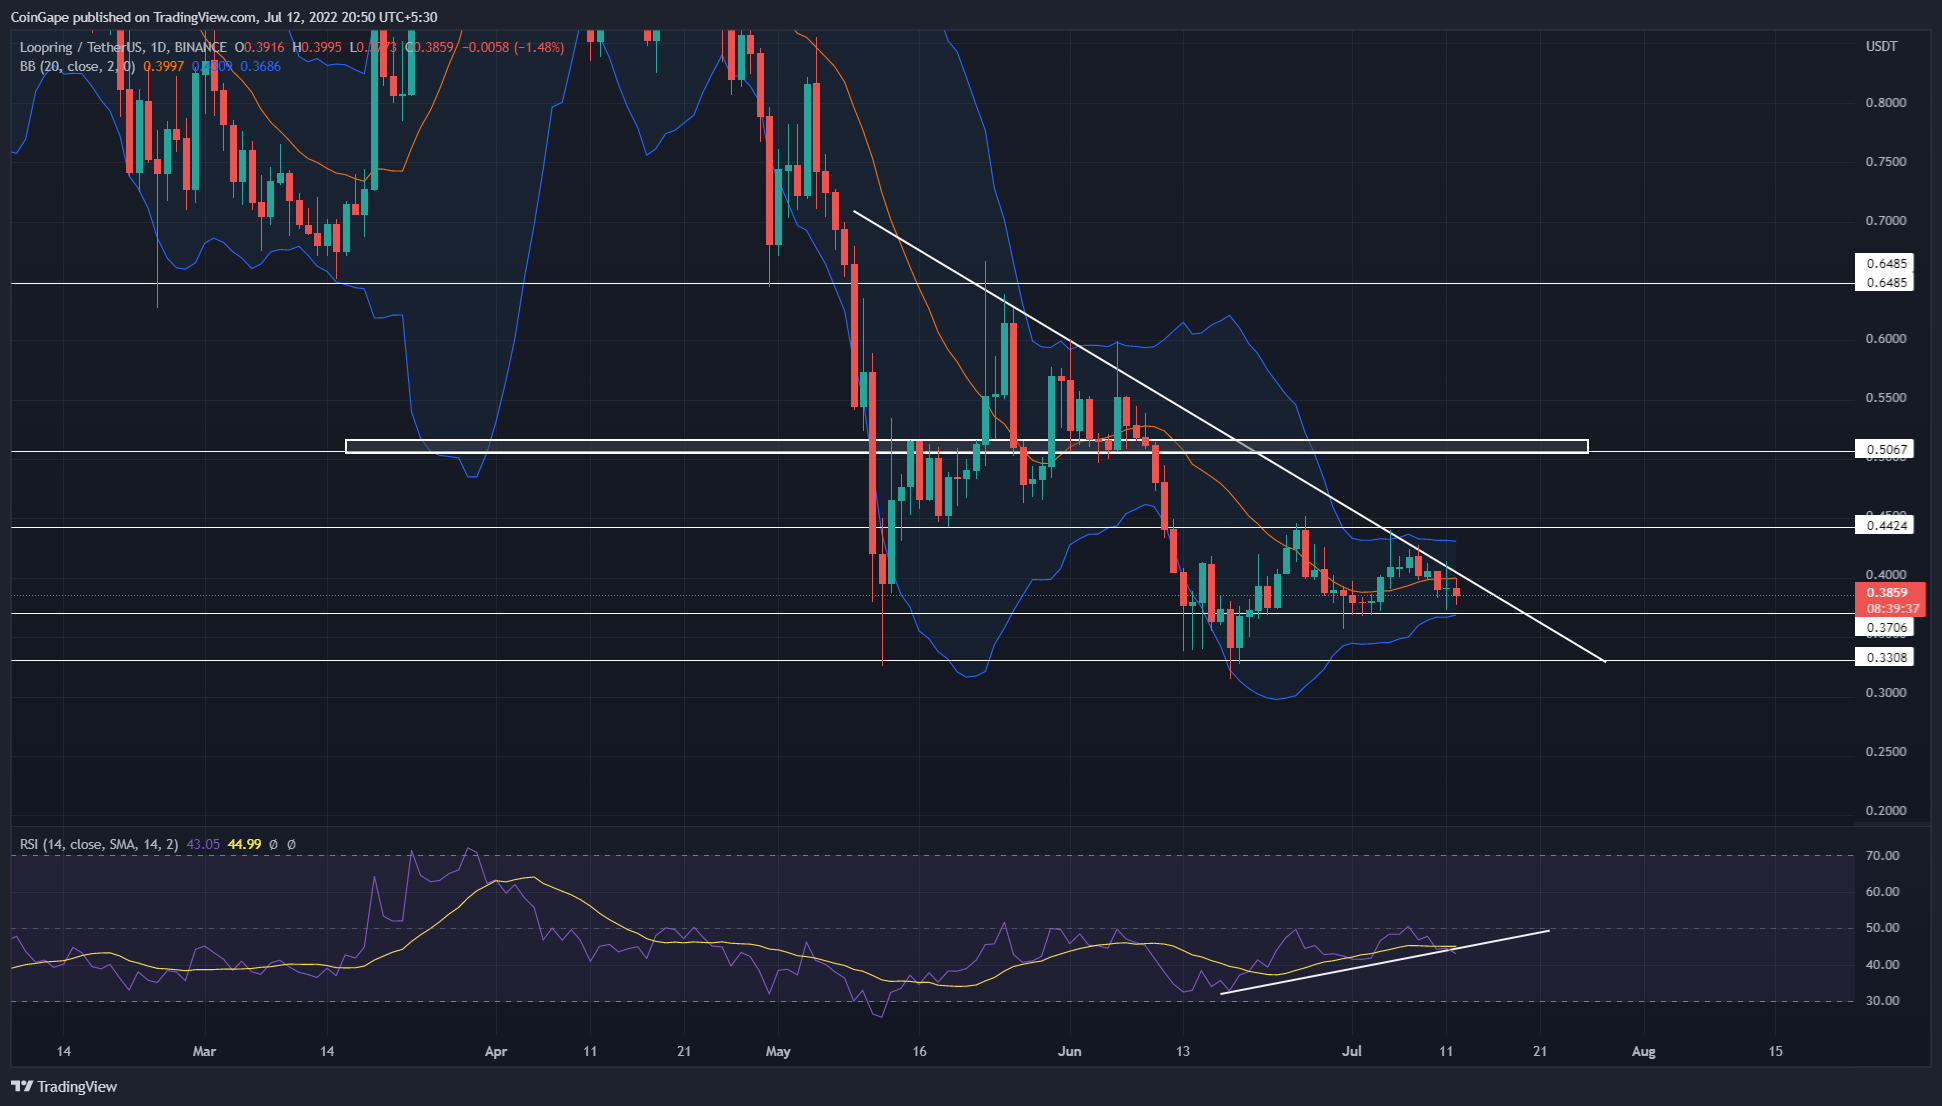 Source-Trading view
Following the early-May sell-off, the LRC/USDT pair has been forming new higher lows under the influence of a descending triangle pattern. Furthermore, the neckline support for the pattern is located at $0.33, preventing a further downfall.
However, within this pattern, the LRC price has resonated between the two horizontal levels of $0.44 and $0.37 for the past three weeks. In addition, the altcoin wavering in this range has retested the descending trendline, replenishing the selling momentum.
The sustained selling should breach range support of $0.37 and slump the altcoin 10.5% lower to the $0.33 neckline.
Moreover, this triangle pattern, in theory, reflects the losing bullish momentum, which should eventually breach the neckline support. Thus, a breakdown from the $0.33 support would indicate the resumption of the prevailing downtrend.
Having said that, the pattern still holds the possibility of a trendline breakout, which may overturn the bearish theory.
Technical Indicator
The super trend indicator highlights an overall downtrend in the daily chart.
However, the daily-RSI slope shows an inverse rally of falling price action, undermining the bearish pattern. This complete divergence supports the bullish breakout from the resistance trendline, which may surge the LRC price to the $0.648 mark.
The Bollinger Band indicator has significantly narrowed its range, accentuating the short consolidation. This breakout from either of its levels may provide additional confirmation on the respective rally.
- Resistance levels- $0.44 and $0.5
- Support levels- $0.37 and $0.33

Why Trust CoinGape
CoinGape has covered the cryptocurrency industry since 2017, aiming to provide informative insights Read more…to our readers. Our journal analysts bring years of experience in market analysis and blockchain technology to ensure factual accuracy and balanced reporting. By following our Editorial Policy, our writers verify every source, fact-check each story, rely on reputable sources, and attribute quotes and media correctly. We also follow a rigorous Review Methodology when evaluating exchanges and tools. From emerging blockchain projects and coin launches to industry events and technical developments, we cover all facets of the digital asset space with unwavering commitment to timely, relevant information.

Related Articles


- XRP Realized Losses Spike to Highest Level Since 2022, Will Price Rally Again?
- Crypto Market Rises as U.S. and Iran Reach Key Agreement On Nuclear Talks
- Trump Tariffs: U.S. Raises Global Tariff Rate To 15% Following Supreme Court Ruling
- Bitwise CIO Names BTC, ETH, SOL, and LINK as ‘Mount Rushmore’ of Crypto Amid Market Weakness
- Prediction Market News: Kalshi Faces New Lawsuit Amid State Regulatory Crackdown
- Dogecoin Price Prediction Feb 2026: Will DOGE Break $0.20 This month?
- XRP Price Prediction As SBI Introduces Tokenized Bonds With Crypto Rewards
- Ethereum Price Rises After SCOTUS Ruling: Here’s Why a Drop to $1,500 is Possible
- Will Pi Network Price See a Surge After the Mainnet Launch Anniversary?
- Bitcoin and XRP Price Prediction As White House Sets March 1st Deadline to Advance Clarity Act
- Top 3 Price Predictions Feb 2026 for Solana, Bitcoin, Pi Network as Odds of Trump Attacking Iran Rise


