 Claim Card
Losing Crucial Support LUNC Coin Price Is At Risk Of 17-25% fall


Over the last two months, the LUNC coin price showed multiple valid attempts to surpass the overhead supply zone of $0.000184-$0.000195. Thus, with the increasing uncertainty in the crypto market due upcoming FOMC meeting, the sellers reclaimed the upper hand and breached the support trendline of the rising wedge pattern. Losing this support, the LUNC price is poised for a directional downfall. These are the levels coin holders should watch.
Key points:
- A bearish breakdown from the wedge pattern’s support trendline threatens the LUNC price for a 17-25% downfall
- the bearish thesis will offer the daily candle closes above the rising trendline
- The intraday trading volume in the LUNC coin is $123.3 Million, indicating a 36.7% gain.
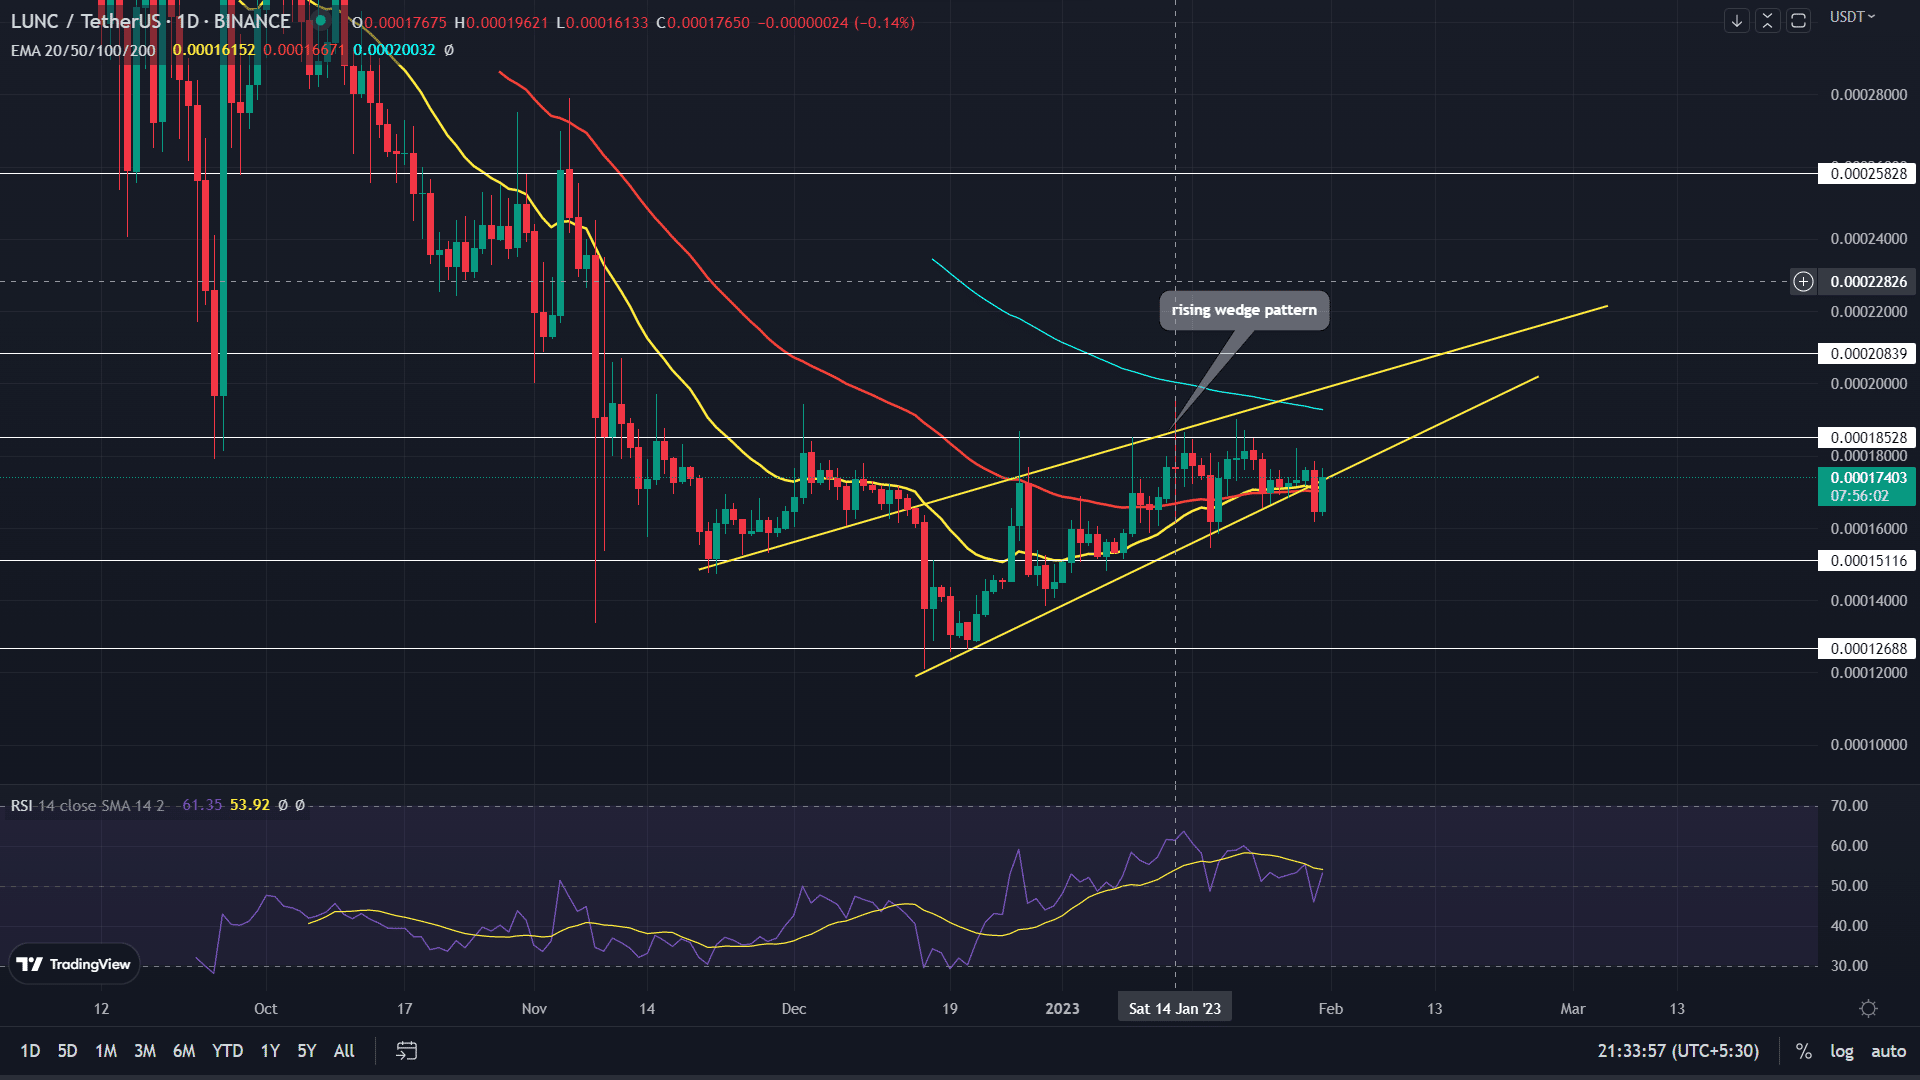 Source- Tradingview
The last two months’ recovery in LUNC coin price shaped into a rising wedge pattern. Two converging trendlines characterize this bearish continuation pattern, with both lines sloping upwards, creating a rocket-type shape. In theory, this pattern prepares a potential reversal from a bullish to a bearish trend as the price of an asset becomes squeezed between the two trend lines.
Thus, on January 30th, the LUNC coin price gave a massive breakdown from the pattern’s support trendline, indicating the release of trapped bearish momentum. Today, though the coin price shows a 5% jump, this bullish candle is meant to retest the breached support and potential resistance.
Also Read: CRYPTO TELEGRAM CHANNELS LIST 2023
The higher price rejection attached to the daily candle indicates the sellers are defending the newly obtained resistance. Moreover, as per technical setup, the higher low during the pattern formation is a potential target for short-sellers after the breakdown.
Thus, if the selling pressure persists, the LUNC price could plunge to $0.00016, followed by $0.000142, or $0.000128
On a contrary note, the daily candle close above the rising trendline will offset the bearish thesis and claim the prior breakdown as a Bear trap.
Technical Indicators
Relative strength index: the descending daily-RSI slope signals the sellers are gradually taking trend control. Thus, a breakout of the RSI line below the midline will give additional confirmation for the aforementioned downfall.
EMAs: with the recent breakdown, the LUNC price loses the support of 20-and-50-day EMAs, which in turn is in favor of sellers.
LUNC Crypto Price Intraday Levels
- Spot rate: $0.000172
- Trend: Bullish
- Volatility: High
- Resistance level- $0.000184 and $0.000195
- Support level- $0.00016 and $0.000142

Why Trust CoinGape
CoinGape has covered the cryptocurrency industry since 2017, aiming to provide informative insights Read more…to our readers. Our journal analysts bring years of experience in market analysis and blockchain technology to ensure factual accuracy and balanced reporting. By following our Editorial Policy, our writers verify every source, fact-check each story, rely on reputable sources, and attribute quotes and media correctly. We also follow a rigorous Review Methodology when evaluating exchanges and tools. From emerging blockchain projects and coin launches to industry events and technical developments, we cover all facets of the digital asset space with unwavering commitment to timely, relevant information.

Related Articles


- Expert Predicts Deeper Bitcoin Decline as JPMorgan CEO Warns of Similarities to the 2008 Financial Crisis
- Trump Won’t Pardon FTX’s Sam Bankman-Fried (SBF), White House Says
- Third Spot SUI ETF Goes Live as 21Shares Fund Launches on Nasdaq
- Mark Zuckerberg’s Meta Reportedly Eyes Stablecoin Integration This Year Amid Regulatory Clarity
- Coinbase Rivals Robinhood As It Rolls Out Stocks, ETFs Trading In ‘Everything Exchange’ Push
- Cardano Price Signals Rebound as Whales Accumulate 819M ADA
- Sui Price Eyes Recovery as Third Spot SUI ETF Debuts on Nasdaq
- Pi Network Price Eyes a 30% Jump as Migrations Jumps to 16M
- Will Ethereum Price Dip to $1,500 as Vitalik Buterin Continues Selling ETH?
- XRP Price Outlook as Clarity Act Passage Odds Plunge to 53%
- COIN Stock Risks Crashing to $100 as Odds of US Striking Iran Jump


