 Buy $GGs
Low Volume Recovery In Solana Price Hints Potential Fall To $30


The recent sell-off in the crypto market offset the prior recovery in Solana price. The buyers currently stall this downfall at local support of $32.7, but the low volume activity in their attempts keeps the correction threat on the table. Thus, will buyers resume the bullish recovery from this support, or is further downfall on its way?
Key points from Solana price
- A bearish breakdown below the $30 support will plunge the SOL price back to the $26 bottom support.
- The 20-day EMA has flipped into potential resistance.
- The 24-hour trading volume in the Solana coin is $1.16 Billion, indicating a 31% loss.
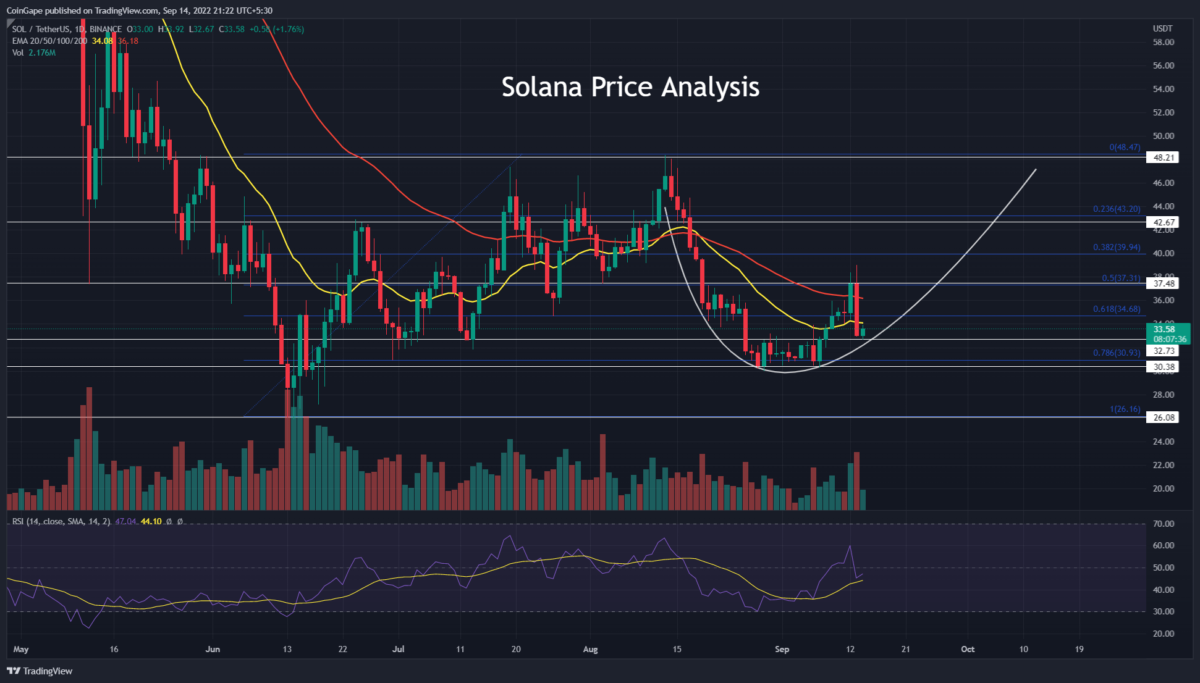
 Source-Tradingview
The August second-half correction has triggered a sideways rally in Solana’s daily time frame. So far, the bearish reversal has stalled at the combined support of 0.786 Fibonacci retracement level and $30.38. The replenished bullish momentum at this support surged the prices in a U-shaped pattern and accounted for a 23.7% rally.
The bull-run strikes $37.5 resistance but could not surpass it due to the sudden selling pressure on September 13th. This sell-off was triggered by the high consumer price index(CPI) data of 8.1% Y-O-Y inflation, causing a 12% fall in Solana’s price.
Thus, the bearish engulfing breached the 20-and-50-day EMA, hitting local support of $32.73. today, the Solana price is 1.64% up and gives a low volume retest to the 20-day EMA resistance. Therefore, if the selling pressure persists, the sellers breach the $32.7 support and revisit the August-September bottom support of $30.
The coin holders should keep a close watch on the price action at $30 support as a potential reversal may validate a high accumulation zone and undermine the panic-selling fall in the market.
Technical indicator
Bollinger band indicator: the Solana coin trading above the indicator’s midline indicates despite yesterday’s downfall, the market value is bullish in terms of the current price range. Moreover, this midline may act as an additional support level.
RSI indicator: the daily-RSI slope nosedive below the neutral line indicates the market sentiment is turning negative.
- Resistance level- $37.5 and $42.6
- Support levels- $32.7 and $30
Play 10,000+ Casino Games at BC Game with Ease
- Instant Deposits And Withdrawals
- Crypto Casino And Sports Betting
- Exclusive Bonuses And Rewards


Why Trust CoinGape
CoinGape has covered the cryptocurrency industry since 2017, aiming to provide informative insights Read more…to our readers. Our journal analysts bring years of experience in market analysis and blockchain technology to ensure factual accuracy and balanced reporting. By following our Editorial Policy, our writers verify every source, fact-check each story, rely on reputable sources, and attribute quotes and media correctly. We also follow a rigorous Review Methodology when evaluating exchanges and tools. From emerging blockchain projects and coin launches to industry events and technical developments, we cover all facets of the digital asset space with unwavering commitment to timely, relevant information.

Related Articles


- Bitcoin Treasury Firm MARA Considers Selling BTC Reserves After Policy Update
- Cardano Founder Warns Over CLARITY Act, Cites Lack of Protection for DeFi, Stablecoins, Prediction Markets
- Core Scientific Sells 1,900 BTC as Bitcoin Miner Pivots to AI, CORZ Stock Dips
- Bitcoin News: VanEck CEO Projects Gradual BTC Rally in 2026 as ETFs Sees $458M Inflows
- Bitcoin, Gold Slip as Donald Trump Says “Unlimited Munition Stockpiles” for US-Iran War
- Circle Stock Price Climbs 15% to $96, Can Rally Continue in March 2026?
- Bitcoin Price Prediction as US-Iran War Enters 4th Consecutive Day
- Top 5 Historical Reasons Dogecoin Price Is Not Rising
- Pi Coin Price Prediction for March 2026 Amid Network Upgrade, KYC Boost, Rewards Distribution
- Gold Price Nears ATH; Silver Eyes $100 Breakout on Us- Iran War
- Bitcoin And XRP Price As US Kills Iran Supreme Leader- Is A Crypto Crash Ahead?


