 Buy Presale
LUNC Price Gears Up for 25% Rally in Near Term; Here’s the Catch


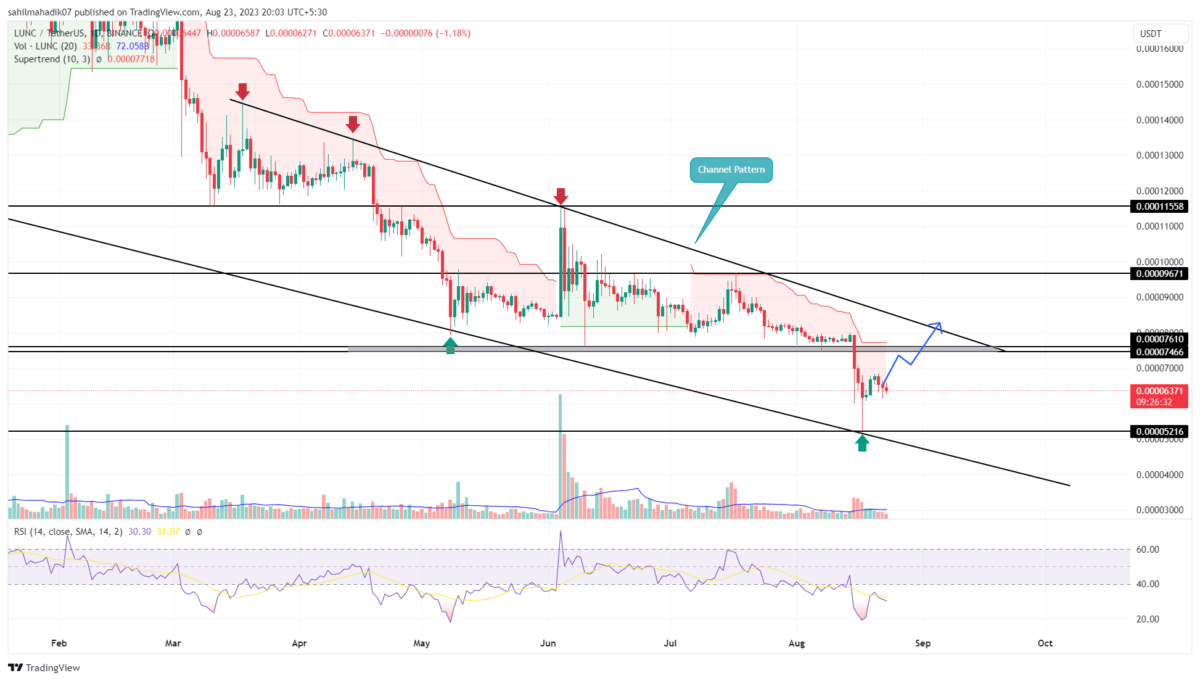
The Terra Classic coin started witnessing aggressive selling in mid-August leading to a sharp drop from $0.0000658 to $0.00005234. The downfall recorded a 34% drop retesting the support trendline of the falling channel pattern. The coin price has rebounded several times from dynamic, leading to a bullish bounce in its ongoing recovery. Here’s how this chart setup could influence further trends in LUNC price.
Also Read: Terra Luna Classic’s Vision For Revival And Better Governance
Terra Classic Daily Chart: Key Points
- The LUNC price may prolong the current downturn until the channel pattern is intact.
- A bullish reversal from the support trendline set the coin price for a 25% upswing
- The intraday trading volume in the LUNC coin is $17.8 Million, indicating a 36% loss.
 Source- Tradingview
The Terra classic coin has witnessed a more steady downtrend in the last six months under the influence of a falling channel pattern. The formation of new lower highs and lows reflects the market sentiment is active in selling on bullish bounces.
On August 17th, the daily chart printed a long-tail rejection at the lower band of the channel pattern indicating the presence of demand pressure. A bullish pullback from this support has led the prices 22% higher to currently trade at $0.0000638.
If the LUNC price manages to sustain above $0.6 in the coming days, the buyers may lead the recovery rally by another 25% to hit the overhead trendline of the channel. However, the market participants will get a better confirmation for trend reversal if the coin price gives a bullish breakout from the resistance trendline.
Can the LUNC Price Fall Below $0.5?
Until the aforementioned channel pattern is intact, the Terra classic coin may continue to extend its downward trend. While the anticipated recovery provides a 25% growth potential, the market participants must remain cautious at the pattern’s upper trendline. A reversal from the resistance trendline may lead to the next correction phase below the $0.5 low.
- Supertrend: A red film projected in the daily chart reflects the short-term trend is bearish
- Relative Strength Index: The daily RSI slope at the overhead region reflects a high possibility of a bullish bounce.
Play 10,000+ Casino Games at BC Game with Ease
- Instant Deposits And Withdrawals
- Crypto Casino And Sports Betting
- Exclusive Bonuses And Rewards


Why Trust CoinGape
CoinGape has covered the cryptocurrency industry since 2017, aiming to provide informative insights Read more…to our readers. Our journal analysts bring years of experience in market analysis and blockchain technology to ensure factual accuracy and balanced reporting. By following our Editorial Policy, our writers verify every source, fact-check each story, rely on reputable sources, and attribute quotes and media correctly. We also follow a rigorous Review Methodology when evaluating exchanges and tools. From emerging blockchain projects and coin launches to industry events and technical developments, we cover all facets of the digital asset space with unwavering commitment to timely, relevant information.

Related Articles


- BTC Price Rises as U.S. Plans to Hold Trump Tariffs on China Steady
- Crypto Market Soars on Rumors of Trump’s 0% Tax Policy for Digital Assets
- Hong Kong Set to Launch Tokenized Bond Platform and Issue First Stablecoin Licenses
- US Senator Launches Probe Into Binance After Fortune Report on Sanctions Violations
- CLARITY Act Odds, Bitcoin Drop as Trump Skips Crypto in State of the Union Speech
- Cardano Price Signals Rebound as Whales Accumulate 819M ADA
- Sui Price Eyes Recovery as Third Spot SUI ETF Debuts on Nasdaq
- Pi Network Price Eyes a 30% Jump as Migrations Jumps to 16M
- Will Ethereum Price Dip to $1,500 as Vitalik Buterin Continues Selling ETH?
- XRP Price Outlook as Clarity Act Passage Odds Plunge to 53%
- COIN Stock Risks Crashing to $100 as Odds of US Striking Iran Jump


