 Buy $GGs
MANA Price Analysis: Why $1.1 Breakout Could Soar Prices by 26%?


The Decentraland (MANA) price has been on a winning streak for the past four days, accounting for an 11.5% gain. The volume rise during this recovery indicates the traders are confident in rising prices. With sustained buying, the altcoin should escape the past two months’ range rally.
Key points:
- The MANA price faces intense supply pressure from the $1.1 resistance
- The 20-and-50-day EMA bullish crossover attracts more buyers in the market.
- The intraday trading volume in the Decentraland Token is $247.9 Million, indicating a 27% loss.
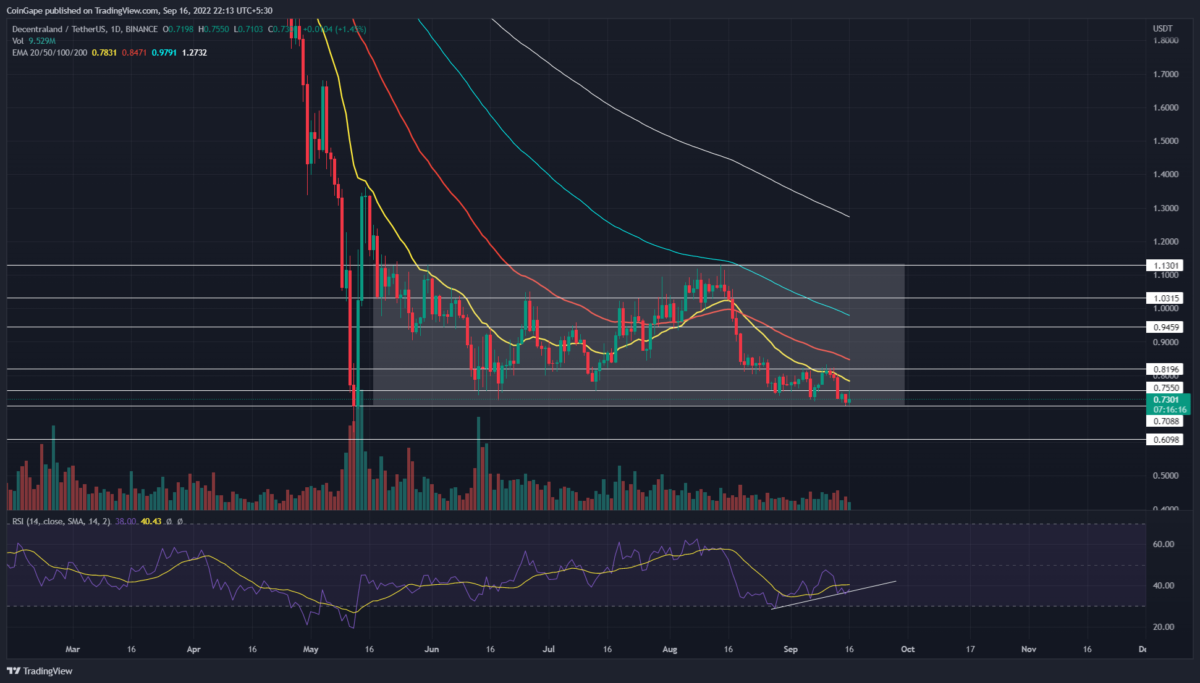
 Source-Tradingview
The MANA/USDT technical chart represents an evident example of a rounding bottom pattern. The bullish reversal pattern has completed its early two stages with a Mid-May-to-June downfall, followed by ongoing consolidation in a range-bound rally.
As per the technical set-up, the MANA price should breach the overhead resistance of $1.1 and lead the coin to $1.36
On July 13th, the MANA price rebounded from the $0.75 bottom support and surged 44.61% within a month. Today, with a 0.88% jump, the coin buyers attempted to end this consolation with a bullish breakout.
However, the daily candlestick closing above the $1.1 neckline resistance within sufficient volume rise is required to confirm this breakout. The post-breakout rally may push the MANA price 26.2% higher to $1.36 resistance.
If the bullish momentum sustains, the altcoin may surpass the ceiling and climb towards the next significant support zone of $1.68.
On a contrary note, if MANA price reverts from the $1.1 resistance, and breakdown from the 20-day EMA will indicate the resumption of the consolidation phase.
Technical indicator
Bollinger band indicator: the recent price jump tags the indicator’s upper band indicates a minor is plausible before the breakout. However, the midline offering dynamic support should maintain the recovery phase.
RSI indicator: The daily-RSI slope shows a more substantial rally than price action, indicating the rising bullish momentum. This positive diverger suggests the price should eventually breach this $1.1 resistance.
- Resistance level: $0.935, $0.75
- Support level: $1.1, $1.36
Play 10,000+ Casino Games at BC Game with Ease
- Instant Deposits And Withdrawals
- Crypto Casino And Sports Betting
- Exclusive Bonuses And Rewards


Why Trust CoinGape
CoinGape has covered the cryptocurrency industry since 2017, aiming to provide informative insights Read more…to our readers. Our journal analysts bring years of experience in market analysis and blockchain technology to ensure factual accuracy and balanced reporting. By following our Editorial Policy, our writers verify every source, fact-check each story, rely on reputable sources, and attribute quotes and media correctly. We also follow a rigorous Review Methodology when evaluating exchanges and tools. From emerging blockchain projects and coin launches to industry events and technical developments, we cover all facets of the digital asset space with unwavering commitment to timely, relevant information.

Related Articles

- Bitcoin Price Still Risks Decline If Iran War Mirrors Ukraine War Market Reaction, JPMorgan Warns
- Bitget Unveils Upgrade For Stock, Gold Trading Alongside Crypto As Part Of Universal Exchange Push
- ChangeNOW Is Settling Crypto Swaps in Under a Minute.
- $3B Western Union Expands Into Crypto With USDPT Stablecoin Launch on Solana
- XRP News: Key Ripple Whale Indicator Turns Bullish After Months, Price Rally Ahead?
- Pi Network Price As BTC Rallies Above $74K: Can PI Coin Extend Gains to $0.30?
- XRP Price As Bitcoin Reclaims $74K- Is $5 Next?
- Dogecoin Price Outlook as BTC Recovers Above $73,000
- XRP Price Prediction as Iran-U.S. Peace Talks Trigger a Crypto Rally
- COIN Stock Analysis as Bitcoin Retests $72k Ahead of February NFP Data
- Robinhood Stock Price Prediction As Cathie Wood Buys $12M Dip in Bold ARK Move


