MATIC Price Analysis: Chart Pattern Born Out of Market Uncertainty Forecasts a Massive Move on Way


MATIC Price Analysis: In response to the choppy price behavior from the market leader Bitcoin, several cryptocurrencies turned sideways reflecting the indecisive sentiment among market participants. Thus, the falling MATIC price went sideways above local support of $0.812 showing no clear sign of a potential trend. However, in the lower time frame chart, the technical chart shows the formation of a symmetrical triangle pattern which could influence the coin’s near future move.
Key Points
- A symmetrical triangle pattern is a continuation pattern that indicates the MATIC price is likely to resume the prevailing downtrend.
- A bearish crossover between the 100-and-200-day EMA could boost the selling pressure in the market.
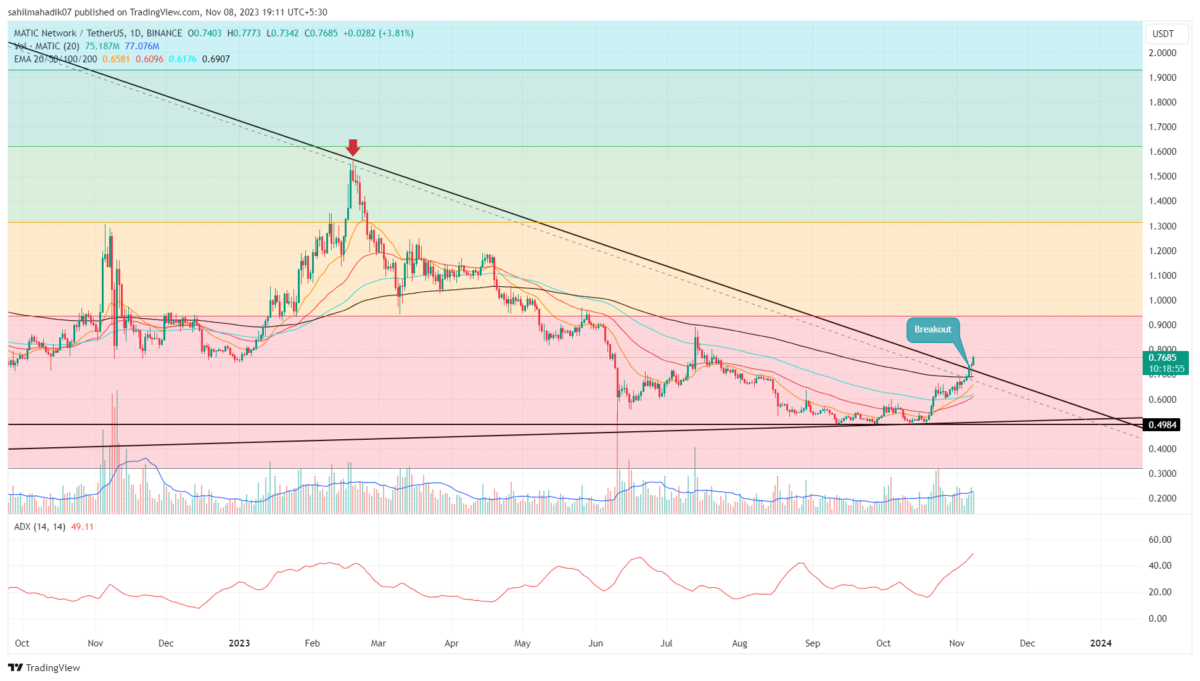
- The intraday trading volume in the MATIC is $364.5 Million, indicating an 8.67% gain.
 Source-Tradingview
In the 4-hour time frame, the ongoing consolidation in MATIC price is strictly confined between two converging trendlines indicating a symmetrical triangle formation. The coin price has rebounded several times from the triangle levels, indicating the traders are responding to this setup and will more likely chase its potential target.
By the press time, the MATIC price trades at $0.859 with an intraday gain of 1.7%. As the prior trade before the consolidation was down, the coin price is more likely to resume the same trend after the completion of the pattern.
Also Read: Top BRC – 20 Tokens Set To Take The Next Big Leap
Thus, the polygon coin price could breach the pattern’s lower trendline and accelerate the selling pressure in the market. The post-breakdown may tumble the prices 12% to hit the $0.76 mark.
However, a less likely scenario would be a bullish breakout from the overhead trendline to trigger a significant upswing.
Technical Indicators
Bollinger Band: Along with support trendline breakdown, the coin price will also challenge the lower band of the BB indicator, suggesting momentum selling in the market.
Relative strength index: A massive surge in the 4-hour RSI slope reflects underlying bullish momentum rising which accentuates the overhead trendline breakout is plausible.
MATIC Coin Price Intraday Levels
- Spot rate: $0.861
- Trend: Bullish
- Volatility: High
- Resistance levels- $0.9 and $0.94
- Support levels- $0.82 and $0.748

Why Trust CoinGape
CoinGape has covered the cryptocurrency industry since 2017, aiming to provide informative insights Read more…to our readers. Our journal analysts bring years of experience in market analysis and blockchain technology to ensure factual accuracy and balanced reporting. By following our Editorial Policy, our writers verify every source, fact-check each story, rely on reputable sources, and attribute quotes and media correctly. We also follow a rigorous Review Methodology when evaluating exchanges and tools. From emerging blockchain projects and coin launches to industry events and technical developments, we cover all facets of the digital asset space with unwavering commitment to timely, relevant information.

Related Articles


- Arizona Advances Bitcoin, XRP Reserve Bill Using Seized Crypto Assets
- Bitcoin ETF Update: BlackRock Signals BTC Sell-Off as Kevin O’Leary Warns of Decline In Institutional Demand
- Breaking: Tom Lee’s BitMine Buys 45,759 ETH as CryptoQuant Flags Potential Bottom For Ethereum
- Breaking: U.S. CFTC Moves To Defend Polymarket, Kalshi From Regulatory Crackdown By State Regulators
- Breaking: Michael Saylor’s Strategy Adds 2,486 BTC Amid Institutional Concerns Over Quantum Threat To Bitcoin
- Pi Network Price Beats Bitcoin, Ethereum, XRP as Upgrades and Potential CEX Listing Fuels Demand
- 5 Things Dogecoin Price Needs to Hit $0.20 in Feb 2026
- Bitcoin Price Prediction as Experts Warns of Quantum Risks
- Dogecoin, Shiba Inu, Pepe Coin Price Predictions As BTC Crashes Below $68k
- Ethereum Price Outlook as Harvard Shifts Focus from Bitcoin to ETH ETF
- HOOD and COIN Stock Price Forecast as Expert Predicts Bitcoin Price Crash to $10k


