
MATIC Price Analysis: Will $MATIC Price Reclaim $1 in July?


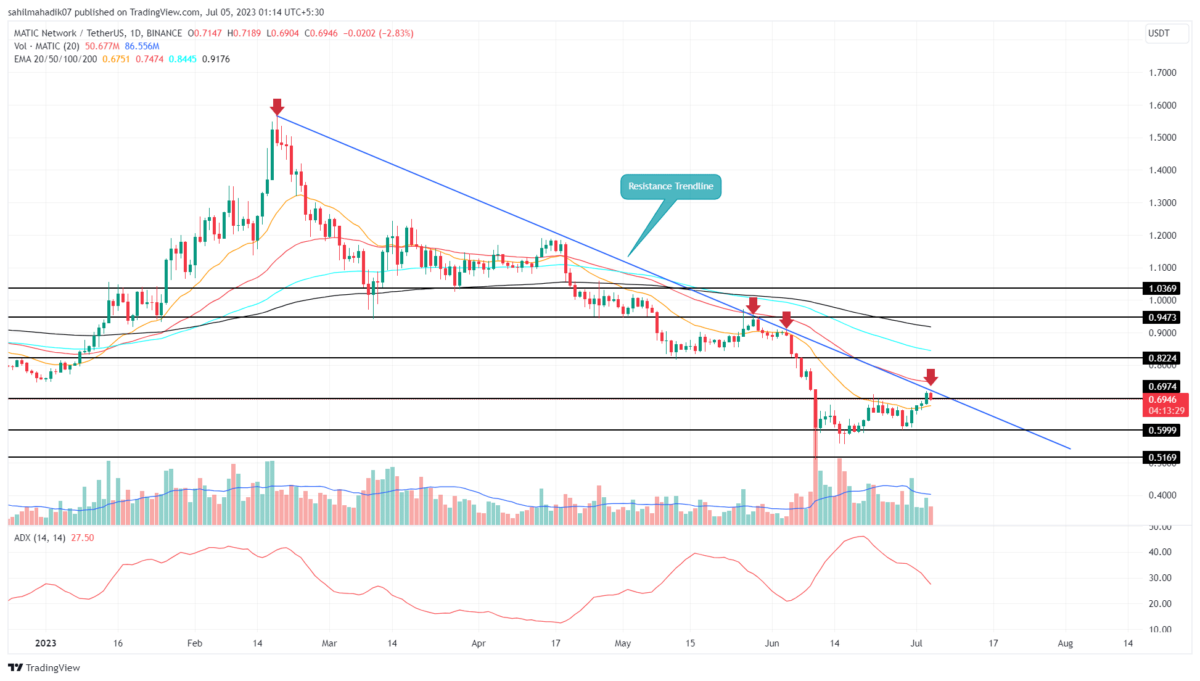
MATIC Price Analysis: Over the past three weeks, the MATIC price has shown a silent recovery in the daily time frame chart. From the June low of $0.5089, the coin price surged 40% to reach this month’s high near $0.72. Amid this breakout, the coin price showed a bullish breakout from the $0.694 horizontal resistance, which should boost the buying pressure in the market. However, with a suitable follow and overhead supply pressure from the downsloping trendline, this breakout may fail to trigger a steeper fall.
Also Read: Polygon 2.0 Architecture Unveiled, MATIC Price Surges by 5.6%
MATIC Price Daily Chart
- A potential reversal from the resistance trendline sets the MATIC price for a potential fall of 13.7%
- A fake breakout from the $0.694 resistance may accelerate selling pressure among traders
- The intraday trading volume in the MATIC is $289.5 Million, indicating a 15.5% loss.
 Source-Tradingview
With an intraday loss of 2.85%, the MATIC price turned down from a downsloping resistance trendline. Over the past four months, the price has revered thrice from this dynamic resistance, indicating the traders have been actively selling bullish bounces which is a key trait of a sustained downtrend.
Therefore, a reversal from this trendline can be an early sign of significant downfall. Currently, the Polygon coin trades at $0.693 and has plunged below the recently reclaimed support of $0.694.
If the falling price closes below the $0.678 low of yesterday’s candle, the buyers’ weapon to trade will break and sellers will have higher command over the trend. The potential downfall could tumble the prices 13.7% lower to hit the $0.6 psychological barrier.
Will MATIC Price Reach to $1 Mark?
For buyers to regain trend control, it needs to breach the long-coming resistance trendline. As per the dow theory of the financial market, no trade remains the same, and therefore, the aforementioned breakout will be the first signal of a trend change. The buyers could drive a post-breakout rally to $0.822, followed by $0.947 and $1.036.
- Average Directional Movement Index: The falling ADX slope also reflects the weakening of bearish momentum.
- Exponential Moving Average: IF the falling prices breached the 20-day EMA slope the short-sellers will gain an extra edge.
Play 10,000+ Casino Games at BC Game with Ease
- Instant Deposits And Withdrawals
- Crypto Casino And Sports Betting
- Exclusive Bonuses And Rewards


Why Trust CoinGape
CoinGape has covered the cryptocurrency industry since 2017, aiming to provide informative insights Read more…to our readers. Our journal analysts bring years of experience in market analysis and blockchain technology to ensure factual accuracy and balanced reporting. By following our Editorial Policy, our writers verify every source, fact-check each story, rely on reputable sources, and attribute quotes and media correctly. We also follow a rigorous Review Methodology when evaluating exchanges and tools. From emerging blockchain projects and coin launches to industry events and technical developments, we cover all facets of the digital asset space with unwavering commitment to timely, relevant information.


- L2 Unity Launches 50M Token Airdrop Across Arbitrum and Optimism, Eligibility Open for 100K Wallets
- Tom Lee’s Bitmine Adds 5,000 ETH Despite $7.5B Unrealized Loss as BMNR Stock Rebounds
- CLARITY Act Should Ban Stablecoin Yields to Advance in Senate, French Hill Says
- U.S. Set to Deploy Warships to Keep the Strait of Hormuz Open, Bitcoin Climbs
- Crypto Market Retraces as Iran Vows to Escalate Conflict After U.S. Strikes on Kharg Island
- Official Trump Price Prediction As TRUMP Token Soars 50% Ahead Mar-a-Lago Invite Buzz for Top Holders
- Solana vs XRP Price Forecast: Can SOL Reclaim Its All-Time High Before XRP Hits $2?
- Top Analyst Predicts Cardano Price Could Surge 100% As Bitcoin Breaks $72k
- What’s Keeping Shiba Inu Below $0.0000065- Analyst Predicts 30% Rise Ahead
- Will BTC Price Rally to $100K by 2026? Kalshi and Polymarket Odds Climb to 51%
- Why Pi Network Price Surged 30% Today?


