MATIC Price May Crash 22% Following Key Support Breakdown


MATIC price recovery rally showed a sharp reversal after reaching a monthly high of $0.89. The broader market sentiment fuelled the bear’s motive and plunged the coin’s market value by 20%. Amid this downfall, the coin buyers recently lost a significant support trendline indicating the polygon coin is poised for an extended correction.
Also Read: Polygon (MATIC) Vs. Chainlink (LINK) Vs. VC Spectra (SPCT) In July 2023
MATIC Price Daily Chart:
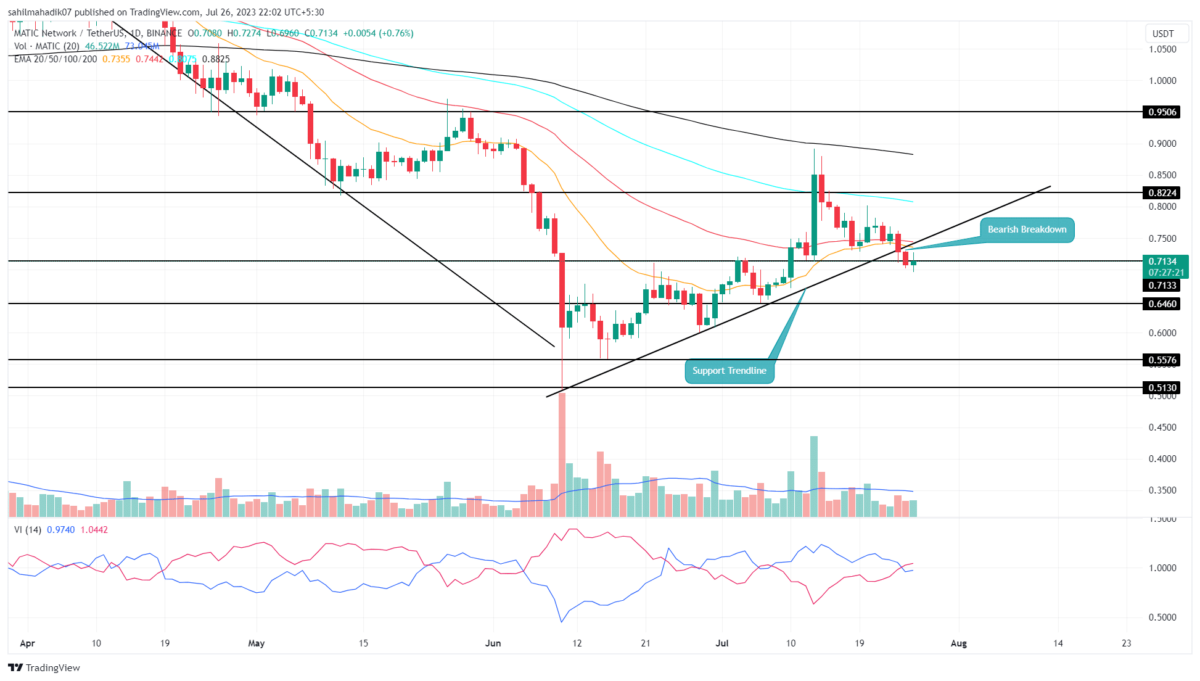
- An ascending trendline breakdown sets the coin price for a 22% drop.
- The polygon coin price trading below the daily EMAs(20, 50, 100 and 200) reflect the overall market trend as bearish
- The intraday trading volume of the MATIC coin is $303.3 Million, showing a 39% gain.
 Source- Tradingview
On July 24, MATIC price gave a downside breakdown from ascending support trendline carrying a relief rally for the past six weeks. Losing this support, the market sellers recuperated the exhausted bearish momentum and hint the resumption of the prior downtrend.
On the following day, the coin price offered a sufficient follow-up with a 2.75% intraday loss and a crackdown below $0.71 horizontal support. By the press time, the polygon corn price rates at $0.71 of 1.43%.
With sustained selling, the post-breakdown fall could tumble this altcoin’s market value by 22% to reach $0.557, followed by $0.513.
Can Polygon Coin Price Restore Bullish Momentum?
With today’s green candle, the buyers try to counterattack by reclaiming the recently breached $0.71 support. If the coin price closes above yesterday’s high of $0.729, the buyers would continue to push the price higher to invalidate the bear’s recent breakdown. This will create a bear trap scenario and assist Polygon coin price to continue bullish recovery
- Exponential moving average: With the recent downtown, this coin price dropped below the 20-and-50-days EMAs offering additional edge market sellers
- Vortex indicator: The VI+(blue) and VI-(orange) shows increasing bearish momentum.

Why Trust CoinGape
CoinGape has covered the cryptocurrency industry since 2017, aiming to provide informative insights Read more…to our readers. Our journal analysts bring years of experience in market analysis and blockchain technology to ensure factual accuracy and balanced reporting. By following our Editorial Policy, our writers verify every source, fact-check each story, rely on reputable sources, and attribute quotes and media correctly. We also follow a rigorous Review Methodology when evaluating exchanges and tools. From emerging blockchain projects and coin launches to industry events and technical developments, we cover all facets of the digital asset space with unwavering commitment to timely, relevant information.

Related Articles


- Trump’s Board Of Peace Eyes Dollar-Backed Stablecoin For Gaza Rebuild
- Trump’s World Liberty Financial Flags ‘Coordinated Attack’ as USD1 Stablecoin Briefly Depegs
- Trump Tariffs: U.S. Threatens Higher Tariffs After Supreme Court Ruling, BTC Price Falls
- Fed’s Chris Waller Says Support For March Rate Cut Will Depend On Jobs Report
- Breaking: Tom Lee’s BitMine Adds 51,162 ETH Amid Vitalik Buterin’s Ethereum Sales
- COIN Stock Risks Crashing to $100 as Odds of US Striking Iran Jump
- MSTR Stock Price Predictions As Michael Saylor’s Strategy Makes 100th BTC Purchase
- Top 3 Meme Coins Price Prediction As BTC Crashes Below $67k
- Top 4 Reasons Why Bitcoin Price Will Crash to $60k This Week
- COIN Stock Price Prediction: Will Coinbase Crash or Rally in Feb 2026?
- Shiba Inu Price Feb 2026: Will SHIB Rise Soon?


