 Buy $GGs
MATIC Price Heading to $0.5 Support; Buy this Dip?


Amid the recent correction phase in the crypto market, the MATIC price witnessed a V-top reversal from the $0.8819 resistance. This reversal evaporated the entire recovery from the buyers’ build during the June to mid-July recovery, heading towards the last swing low of $0.508. Will the ongoing downfall mark a new 2023 low for polygon coins?
Also Read: Reddit NFT Sale Crosses $40M; Polygon Founder Reveals What’s Next
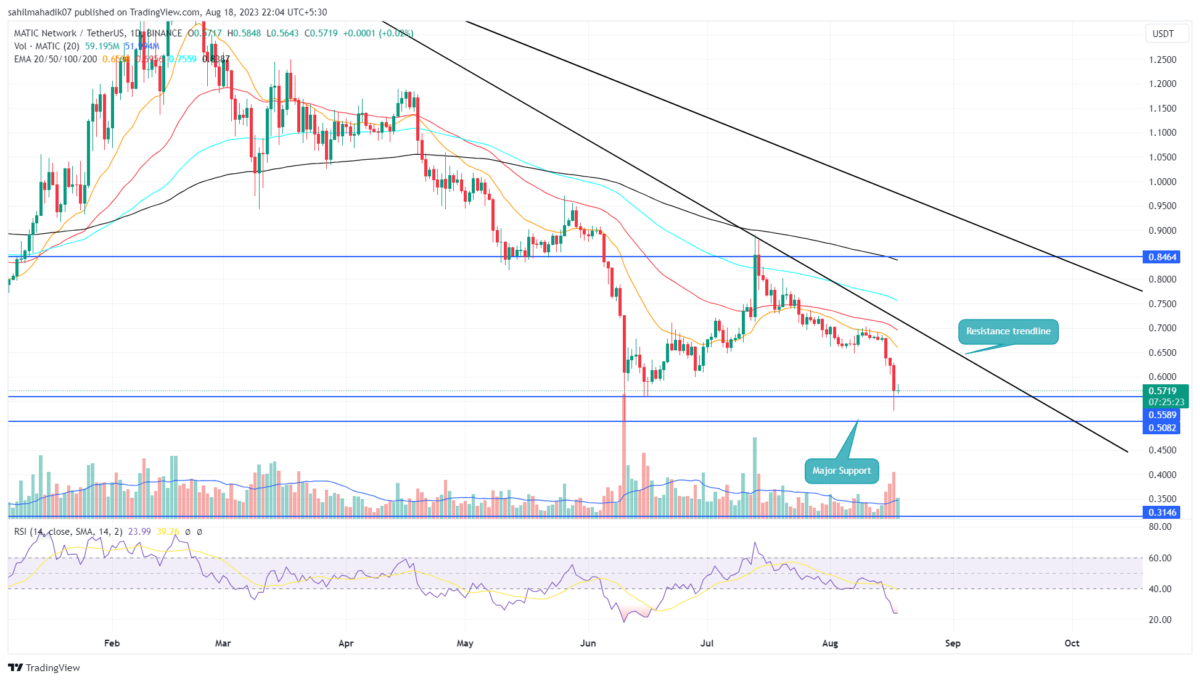
MATIC Price Daily Chart
- The polygon coin may witness strong accumulation at $0.5 psychological support
- A resistance trendline offers dynamic resistance to buyers
- The intraday trading volume of the MATIC coin is $400 Million, showing a 9.8% gain.
 Source- Tradingview
In the last five weeks, the MATIC price dropped from $0.8819 to the current price of $0.5722 registering around a 35% loss of market value. This downfall has brought the coin price to the last lower low which is $0.508, indicating the sellers may reattempt to further extend the downward trend.
The recent sell-off in the crypto market increased the bearish momentum and gave an additional push for a breakdown below $0.0508. If the daily candle is below the aforementioned support, the MATIC price may drop another 38% to reach the 18th June low of $0.316.
In addition, a downsloping trendline of the daily chart shows the direction of the current correction phase. Until this trendline is intact, the polygon coin may face aggressive selling.
[converter id=”matic-polygon” url=”https://coingape.com/price/converter/polygon-to-usd/?amount=1″]
Can Polygon Coin Recovery Back to $0.89?
Despite the massive sell-off witnessed during the early hours of August 15th, the buyers stepped in by day’s end and pushed the prices higher with long-tail rejection. This lower tail reflects the accumulation of buyers at the market dip, projecting the potential of a bullish reversal. In the coming days, if the price action shows a reversal from $0.56 or $0.5, the buyers could wait for a breakout above the overhead trendline to gain additional confirmation. This potential reversal may push the Polygon coming back to $0.891
Play 10,000+ Casino Games at BC Game with Ease
- Instant Deposits And Withdrawals
- Crypto Casino And Sports Betting
- Exclusive Bonuses And Rewards


Why Trust CoinGape
CoinGape has covered the cryptocurrency industry since 2017, aiming to provide informative insights Read more…to our readers. Our journal analysts bring years of experience in market analysis and blockchain technology to ensure factual accuracy and balanced reporting. By following our Editorial Policy, our writers verify every source, fact-check each story, rely on reputable sources, and attribute quotes and media correctly. We also follow a rigorous Review Methodology when evaluating exchanges and tools. From emerging blockchain projects and coin launches to industry events and technical developments, we cover all facets of the digital asset space with unwavering commitment to timely, relevant information.

Related Articles


- Senator Elizabeth Warren Targets Trump-Affiliated World Liberty Financial Over Bank Charter Bid
- JPMorgan Projects Bullish Crypto Market in H2 Following CLARITY Act Approval
- Hong Kong Moves Closer to Crypto Tax Cuts Amid Stablecoin Regulatory Framework
- Popular Analyst Willy Woo Predicts Major Bitcoin Price Crash, Bear Market Bottom Timeline
- Vitalik Buterin Maps Out Quantum Risks as Ethereum Foundation Unveils ‘Strawmap’
- Top 2 Price Predictions Ethereum and Solana Ahead of March 1 Clarity Act Stablecoin Deadline
- Pi Network Price Prediction Ahead of Protocol Upgrades Deadline on March 1
- XRP Price Outlook As Jane Street Lawsuit Sparks Shift in Morning Sell-Off Trend
- Dogecoin, Cardano, and Chainlink Price Prediction As Crypto Market Rebounds
- Will Solana Price Rally to $100 If Bitcoin Reclaims $72K?
- XRP Price Eye $2 Rebound as On-Chain Data Signals Massive Whale Accumulation


